

FRIENDSHIP SYSTEMS regularly watches out for interesting design challenges on which to check CAESES® for bugs and missing functionality. Last week one of our IT guys stumbled across an interesting device to improve emissions as introduced by VW. After watching the video (1 minute) we thought that this would be a perfect application for a quick study.
The Geometry Model
We asked one of our students to set up a parametric model of such a flow transformer. We wanted to be able to vary the number of grid lines, the thickness of the grid wall as well as the length (in flow direction) of the grid. Half an hour later, the student came up with a variable geometry, which is shown in the following pictures:
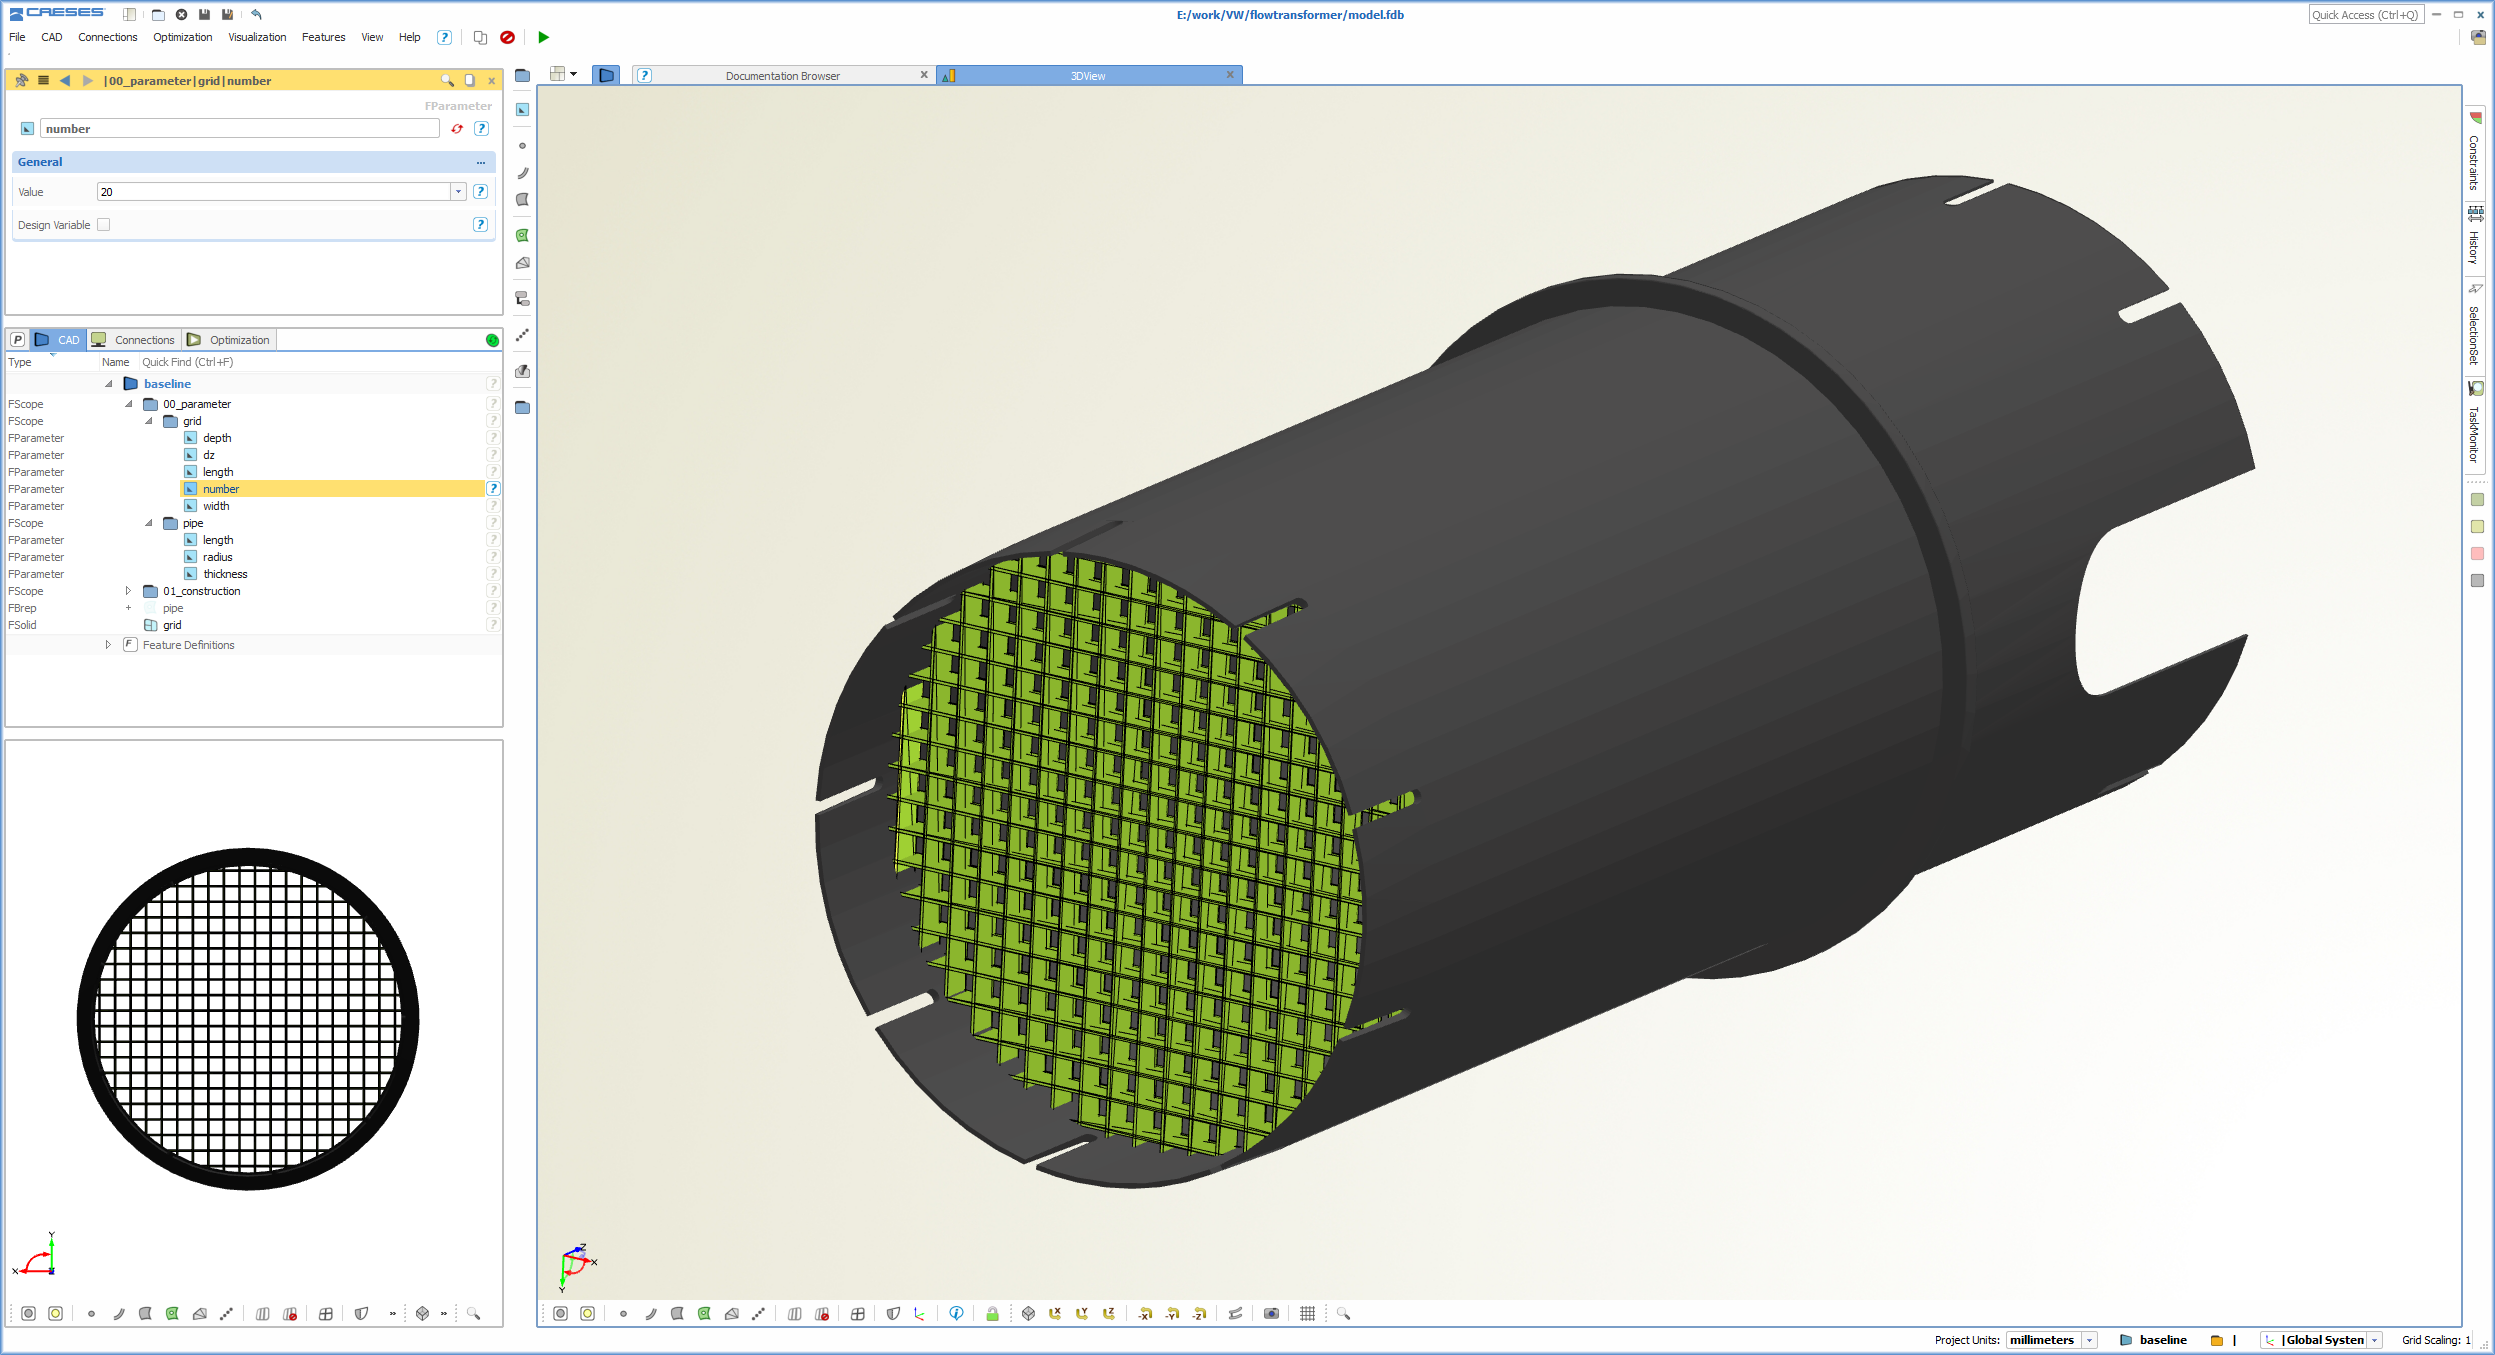
If you are more interested in how it was created, then watch this step-by-step video:
Flow Simulation
Another student took care of the flow simulation, and quickly set up everything in STAR-CCM+, so that we were able to simply check a new design variant with a single click. We made some assumptions for the incoming flow i.e. we disturbed it with some kind of pattern to mimic the turbulent flow patterns downstream of an air filter.
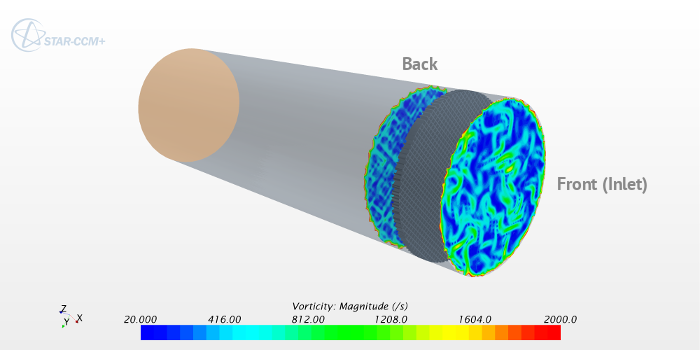
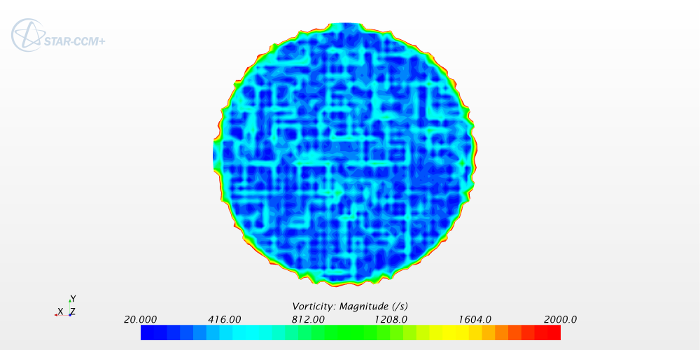
After testing a little bit with the parameters for the grid thickness and grid length, we decided to run a small study for the number of grid lines. Note that when we are saying “grid” here, we don’t talk about the CFD mesh, but the grid of the flow transformer. Here is a typical result that visualizes the turbulence characteristics (vorticity magnitude):
The Largest Grid
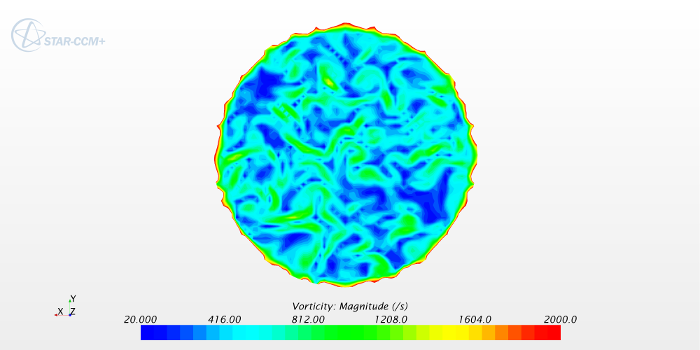
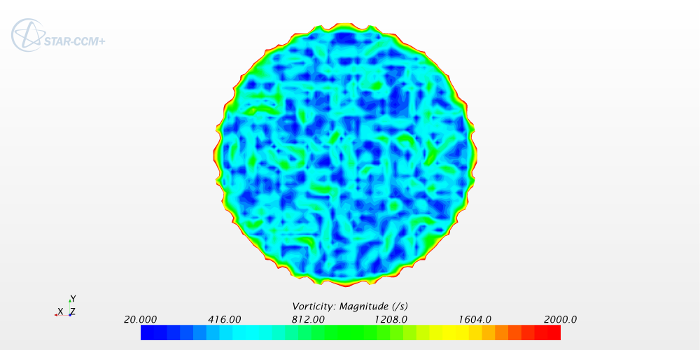
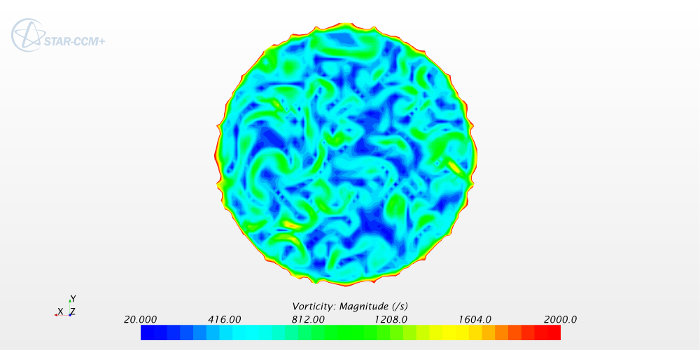
For the largest grid in our study, we used a number of 10 grid lines, and we received the following “Front vs. Back” comparisons (i.e. the first picture shows the flow right before the grid, while the second picture is taken right after the grid):
The Mid-Size Grid
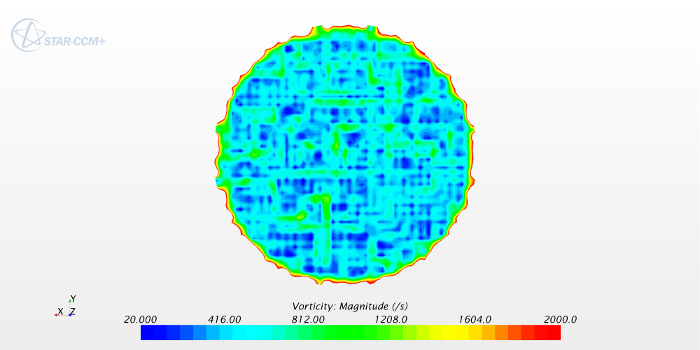
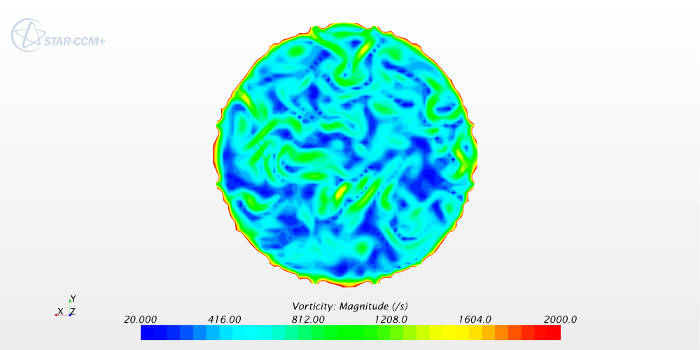
The size of a typical mid-size grid was about 20 grid lines. Here are the two screenshots, again right before and right after the grid:
The Fine Grid
Our finest grid had about 40 grid lines- maybe far too much for such a device, but helpful enough to further visualize what might happen behind the grid:
Summary
We have to admit that things probably are far more complicated than given here in our small study. Primarily, we wanted to check if we have everything in place to realize tasks like this. Anyway, we really enjoyed this work, and finally we could tell our colleague from the IT department: YES, we can do this with CAESES® 🙂
Interested in trying out CAESES® for your application? Then download and install our free version today! It is fully free for commercial work, and you can directly start setting up your own intelligent model.