Simulation-Driven Design of a Race Car Rear Wing
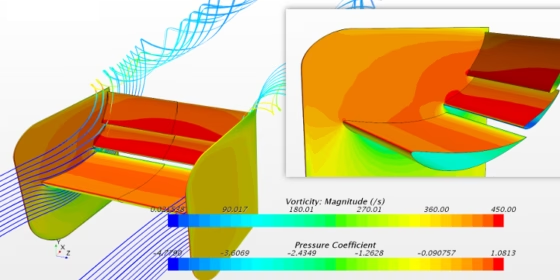
In the last years, we have been supporting student racing teams, such as the FaSTTUBe and the Ryerson Formula Racing Team in Canada. For the Formula Student Germany (FSG) competition, Carolina Cura recently worked on the design and shape optimization of a race car rear wing. The FSG is a national design competition performed every year by students from all over Germany. In this blog post, a brief overview of her optimization work is given, along with a few results.
It’s All About the Downforce
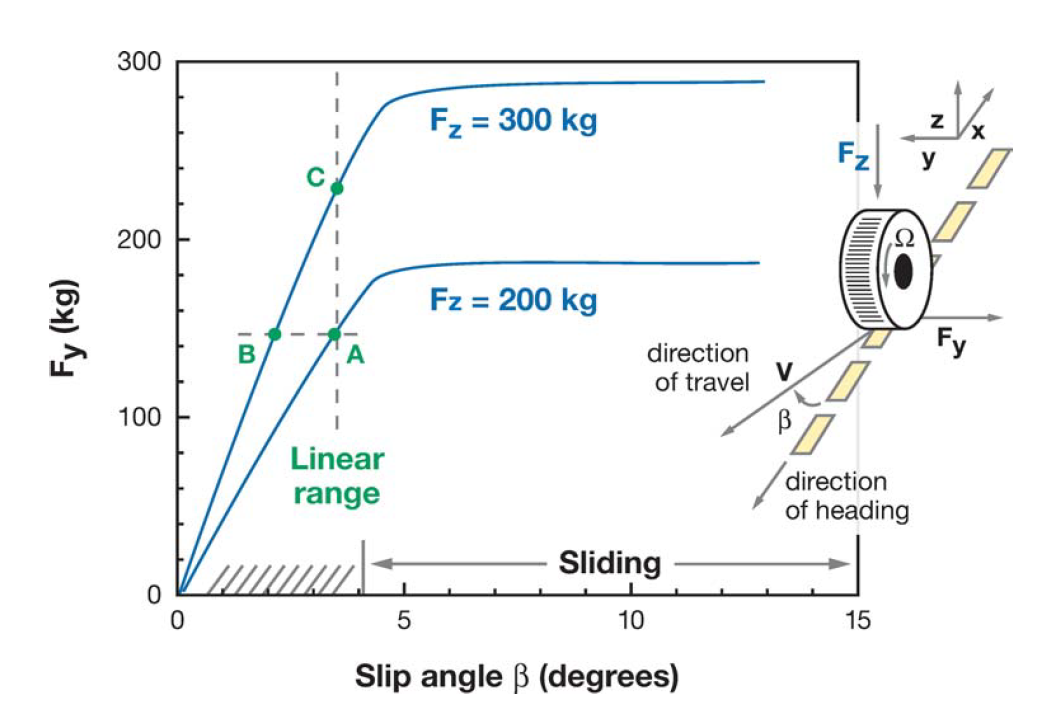
In contrast to Formula 1 or similar racing competitions, the main objective is not constructing the fastest race car, but the best global concept is being decisive. The interplay of design, budgeting, business concept and the racing performance of the vehicle is taken into account. The racing performance is analyzed using categories such as vehicle dynamics, handling, acceleration, endurance and fuel efficiency. In contrast to ordinary vehicle aerodynamics, race car aerodynamics focus mainly on downforce magnitude and distribution, whereas drag force is of secondary importance. Stability and handling of a race car strongly depend on tire performance, which is directly linked to the balance between front and rear downforce. Optimizing the loads on the front and the rear tires therefore leads to enhanced braking performance, cornering speed and thus also stability. Once the general streamlined shape of the race car is set, the balance between rear and front downforce can be strongly influenced by adding so-called wings. The rear wing is known to contribute about as much as one third of the overall downforce of the race car. In contrast to applications in aviation, wings designed for race cars differ from the traditional wings in four different aspects. First of all, they are designed to produce downforce, contrary to the lifting wings of an airplane. Moreover, according to these wings have to be designed to operate in (extreme) ground effect, have small aspect ratios and can have strong interactions with other parts of the body. See the following figure: It can be seen how a sidewise slip of the tire occurs when subjected to a side force, e.g. to inertia due to cornering. As a consequence of the side slip, the direction of motion is at an angle relative to the direction of heading. Increasing the vertical force (downforce) creates less slip for the same side force or the amount of slip at a higher side force, which means that higher cornering forces can be achieved at the expense of the same slip.
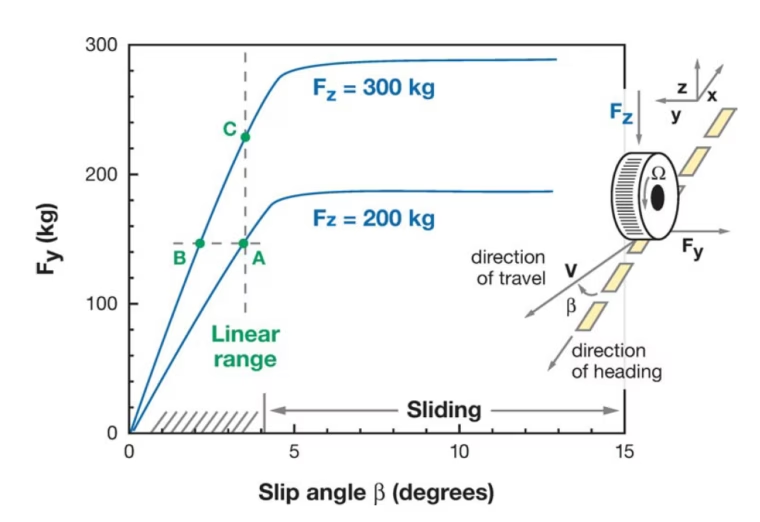
Effect of increased downforce on side force of a race car
Katz 2006
Despite the fact that the addition of wings increases the overall drag force, faster lap times can be achieved by improving the above mentioned vehicle dynamics aspects. The top speed attainable through drag reduction is usually secondary when challenging tracks with fast corners and high speed brakings are faced.
Geometry and CFD Analysis
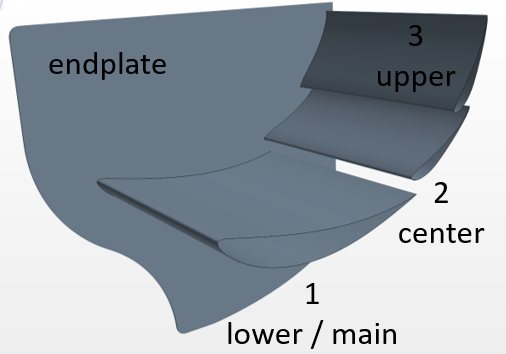
In order to optimize the aerodynamic performance of the rear wing, the corresponding rear wing section consisting of three airfoils and an end plate on each side of the wing is parameterized using CAESES. The starting point for the optimization process is a baseline design that had already been optimized with regard to the positioning of the different wing elements. All viscous flow computations needed for the optimization process are performed with the commercial Reynolds-averaged Navier-Stokes solver STAR-CCM+.
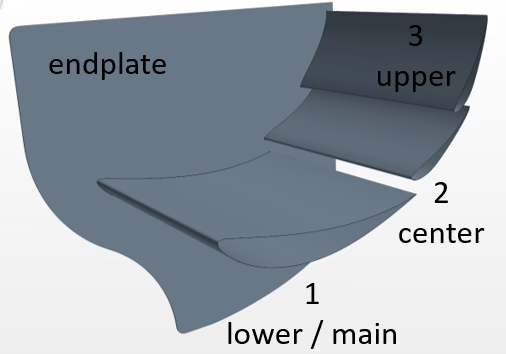
Axis-symmetrical model of the rear wing, consisting of the lower/main wing, the center wing and the upper wing.
Two-Stage Rear Wing Optimization Process
In the first step, a 2D section optimization is conducted to understand and to find the optimal interaction between the three airfoils. In a second step, a full 3D flow simulation is set up and automated in order to optimize the end plate. In this second step, the optimized sections from the 2D study are extruded and combined with the end plate. Parameters such as the shape of the main wing, the longitudinal and vertical position of the main and the second wing as well as the angle of attack of all three wings are varied automatically. For each generated design the meshing process and flow analysis can be automated by using the software connector from CAESES.
Geometry Constraints
In order to prevent unfeasible designs, inequality constraints are included for the optimization. It is necessary to prevent the airfoils from intersecting or touching each other, while the relative position and the angle of attack are varied. For this aim, two curves are defined and monitored. The first line starts at the trailing edge of the main airfoil and ends at the leading edge of the second airfoil. The second line is defined in analogy between the trailing edge of the second airfoil and the leading edge of the third airfoil. The next animation shows how the shape of the main airfoil, the angle of attack of all three airfoils as well as vertical and longitudinal position of main and center airfoil are varied:

CAESES geometry generation: Also make sure that the three sections do not touch or intersect each other
2D Section Optimization
For the 2D optimization of the three wing sections, a set of random designs is generated using the integrated Sobol sampling algorithm of CAESES. After this Design of Experiments (DoE), a local optimization is conducted for a selection of promising design candidates. In order to change the shape of the lower section, a fast delta shift transformation is applied to the original profile. The smaller sections are only rotated and translated by the optimization routine.
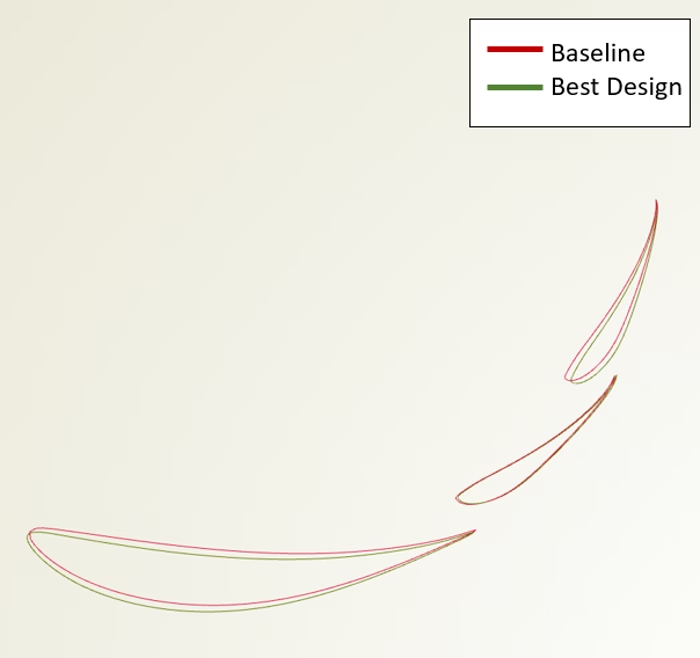
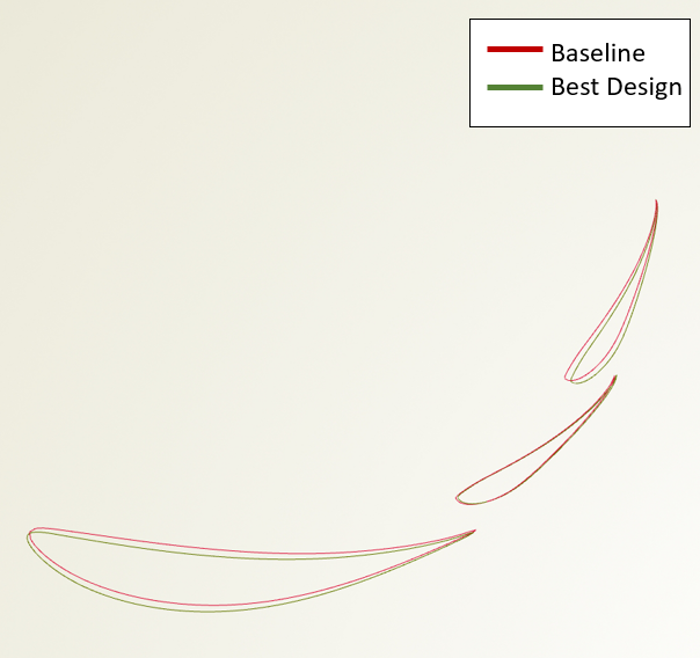
Comparison of best vs. baseline design
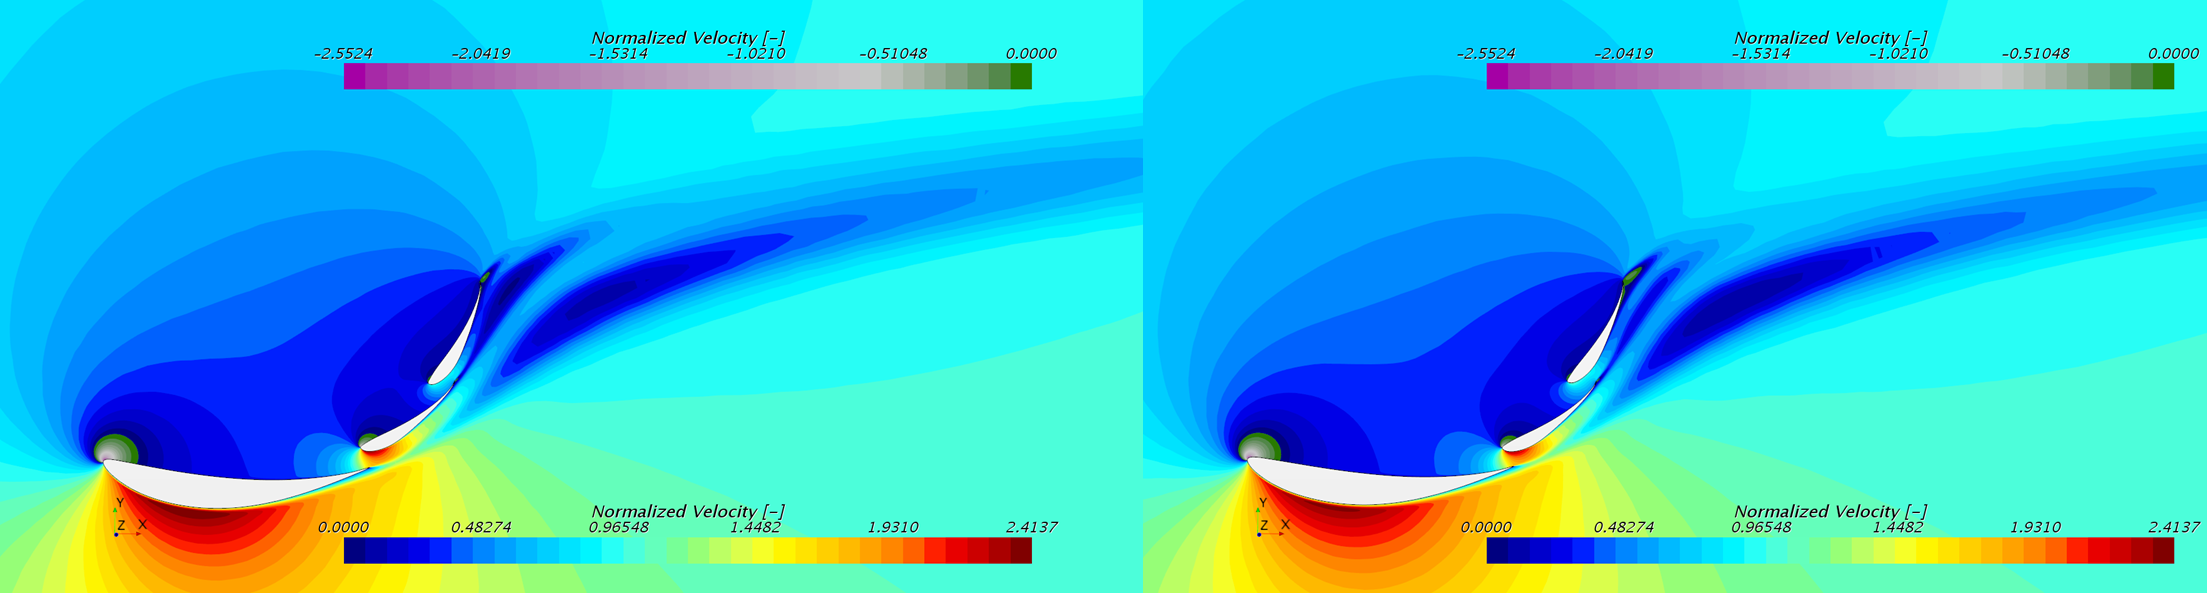
The optimization finally shifted the lower section of the optimal design a bit downwards and slightly forward. The mid wing section does not show substantial changes in position, while the upper wing section of the best design is rotated by a few degrees. The CFD results for the optimized design and the baseline design are shown below. Since the baseline design was already optimized using a different workflow, the visual differences in the velocity distribution are rather small, even though the shape changes have some substantial effect on the overall performance.
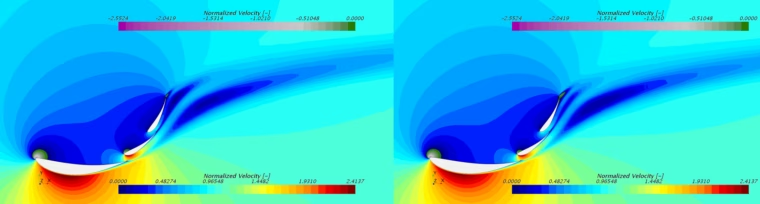
Optimized wings design (left) vs. baseline wings design (right)
In the pictures, the suction region on the lower surfaces of the airfoils are displayed as high normalized velocities. For the optimized airfoils, one can observe slightly higher velocities. The pressure region on the upper surfaces remains similar for both cases, while slightly lower velocities in the flow around the optimized airfoils are generated.
3D Optimization of the End Plate
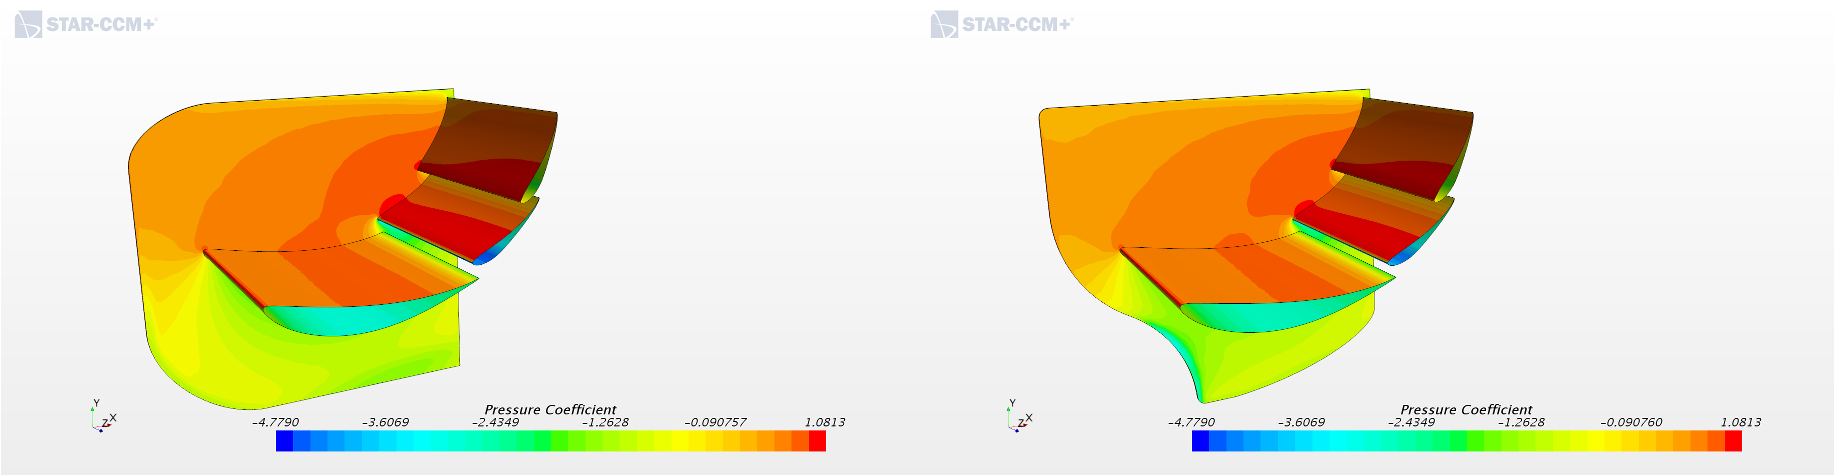
The optimal wing designs from the 2D study are then used as fixed geometry for the 3D optimization where the rear wing end plate is varied and analyzed. The shape of the end plate is defined by a parametric CAESES model, which allows the optimization strategy to modify the lower left and upper left corner of the plate. The pictures below show the pressure coefficient distribution for the optimized end plate and the baseline end plate design. The increase in downforce is mainly due to a strong pressure increase on the pressure side, while the suction side remains similar for both cases.
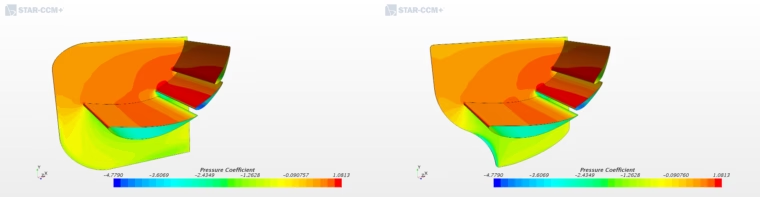
Optimized end plate (left) vs. baseline end plate design (right)
Check with Full Vehicle Setup
At the end of the end plate optimization process, preliminary simulations of the entire race car, equipped with the baseline rear wing design as well as the optimized rear wing design (optimized airfoils and end plate) are tested to assess the results. The final optimization results give an increase of the overall downforce magnitude by 3.9% for the full vehicle setup. When splitting up the two different optimization stages, the 2D optimization led to a ~2.14% improvement of the downforce magnitude, while the 3D optimization delivered roughly 2.44% of improvement.
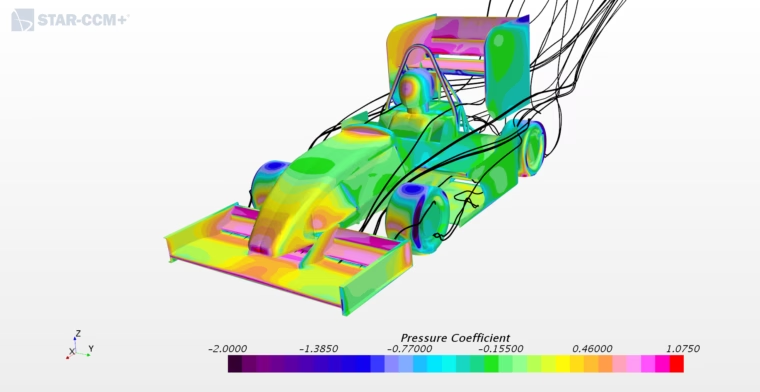
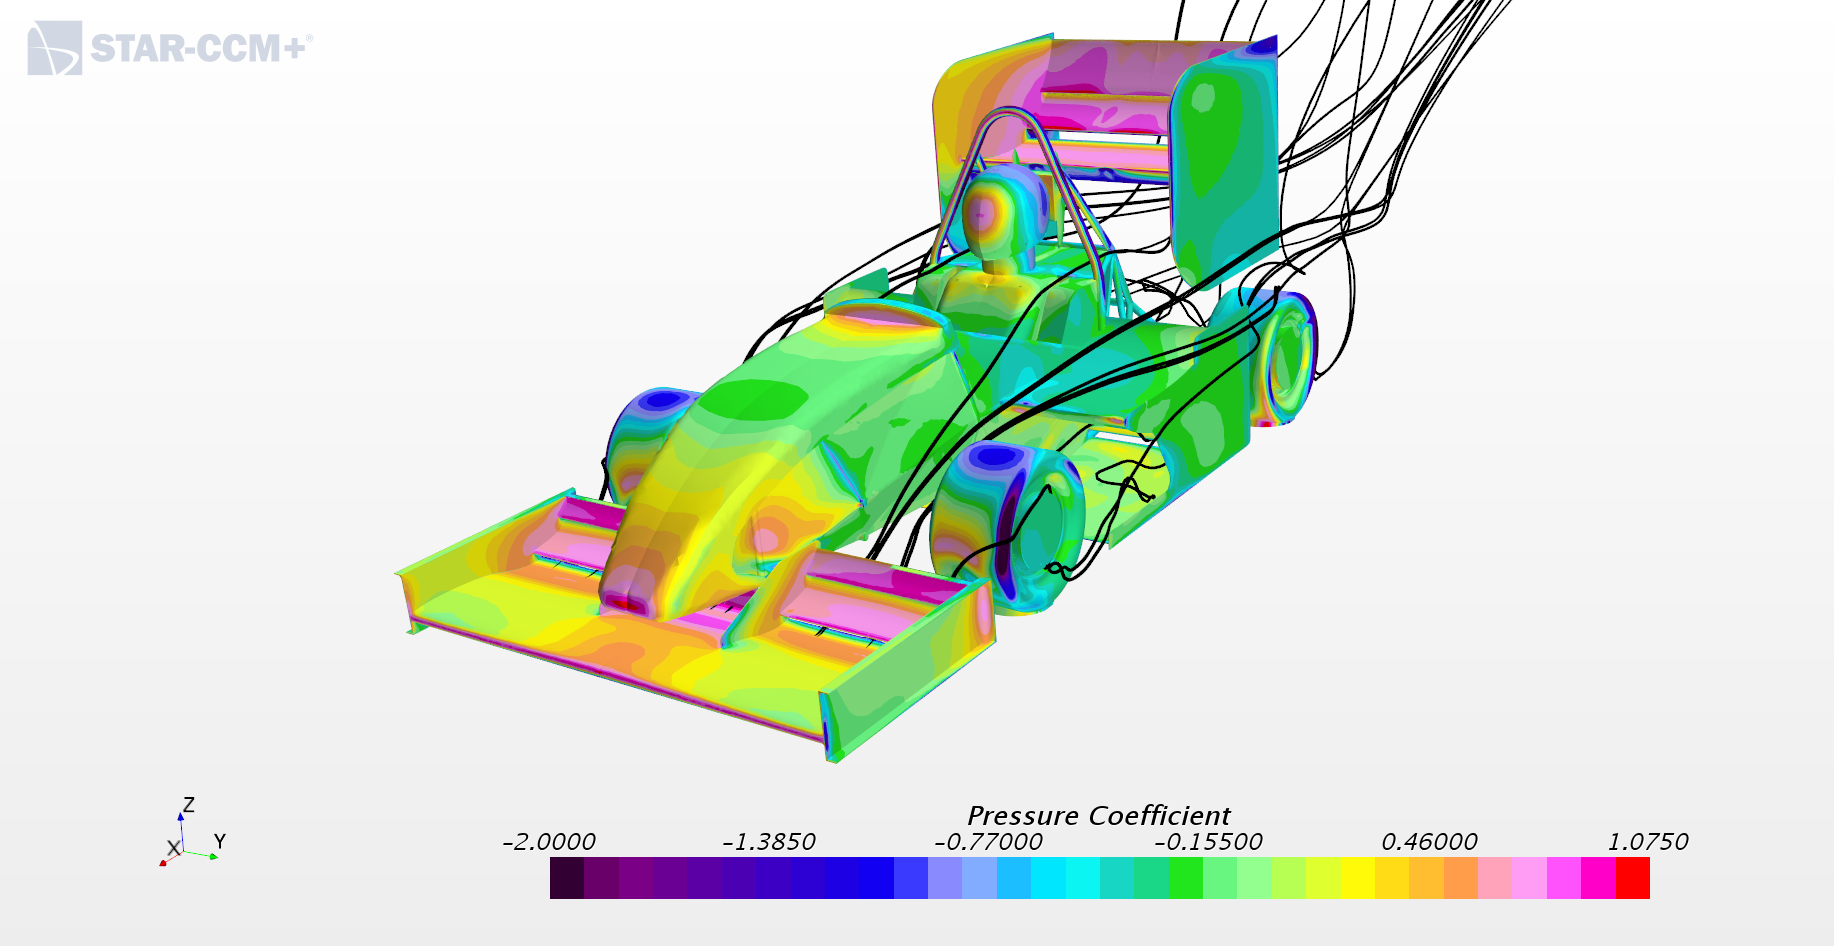
Analysis of the full vehicle setup to check the rear wing optimization results
Follow Us
Feel free to contact us if you like to receive more information about this work. If you are interested in CAESES® and in CFD-driven design optimization in general, then sign up for our newsletter. Don’t worry, we won’t bother you with too many emails. Of course, you can unsubscribe at any time :-)