Optimization of a Catalytic Converter
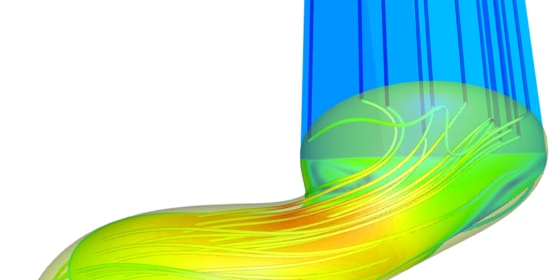
The design of engine components for cars is a tricky task, because there are so many constraints involved. An example is the duct that is located right before the catalytic converter. This component is often bent quite heavily due to space constraints. As a result, this makes it a tough challenge to design it in a way that the flow distribution is sufficiently uniform. In other words, bad flow characteristics in the catalytic converter lead to poor performance, and possibly higher emissions.
In one of our customer projects we had worked on the optimization of such a duct, where three tools were involved:
- CAESES® for geometry modeling and the automated optimization
- GridPro for meshing the generated design candidates
- OpenFOAM for CFD analysis
In the following sections, we briefly outline the workflow of this design task.
Geometry for Robust Duct Variation
CAESES® was used to create an intelligent parametric model of the duct, which was varied with a small set of suitable parameters. We set up a meta surface which basically swept a variable ellipse section. This means that the shape of the ellipse section along the path was varied by using function graphs, plus the sweep path was varied by design variables, too.
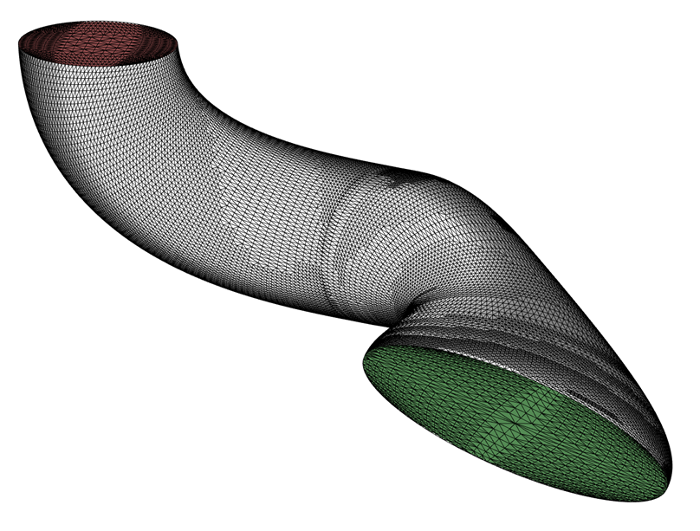
We prepared the baseline design such that a closed geometry could be generated for all subsequent variants, including inlet and outlet boundaries for which we used a coloring mechanism. In CAESES®, the boundaries can be named by setting custom color names and by assigning these colors to the surface patches. The following picture shows a typical colored STL output:
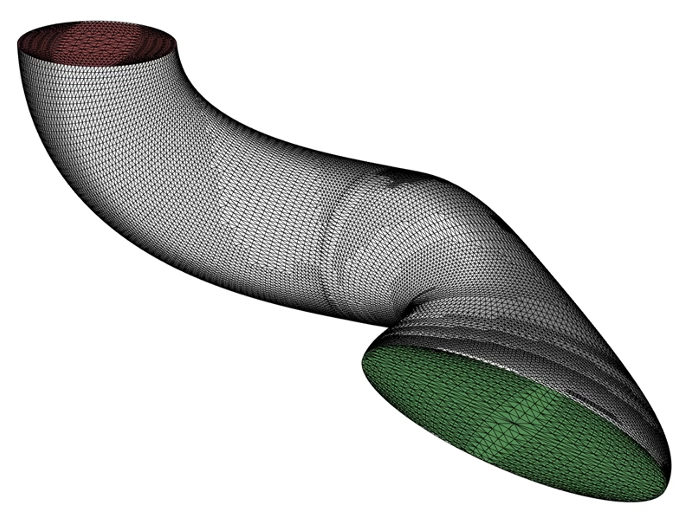
Example of a Closed Duct Geometry
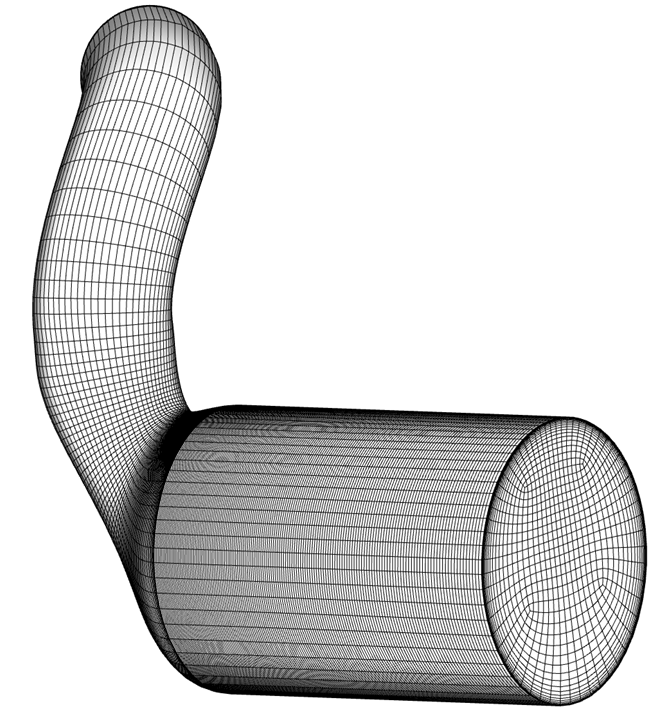
Setting up a closed geometry needs to be done only once, and then a user can recycle all settings during a design study or optimization. The next animation shows automated shape changes of the duct geometry: For each design a closed STL file is automatically generated and later on transferred to the meshing tool. Note that in the animation below we show very strong changes, just for demonstration purposes. Usually, the geometry changes are much smaller when starting from a given baseline design.
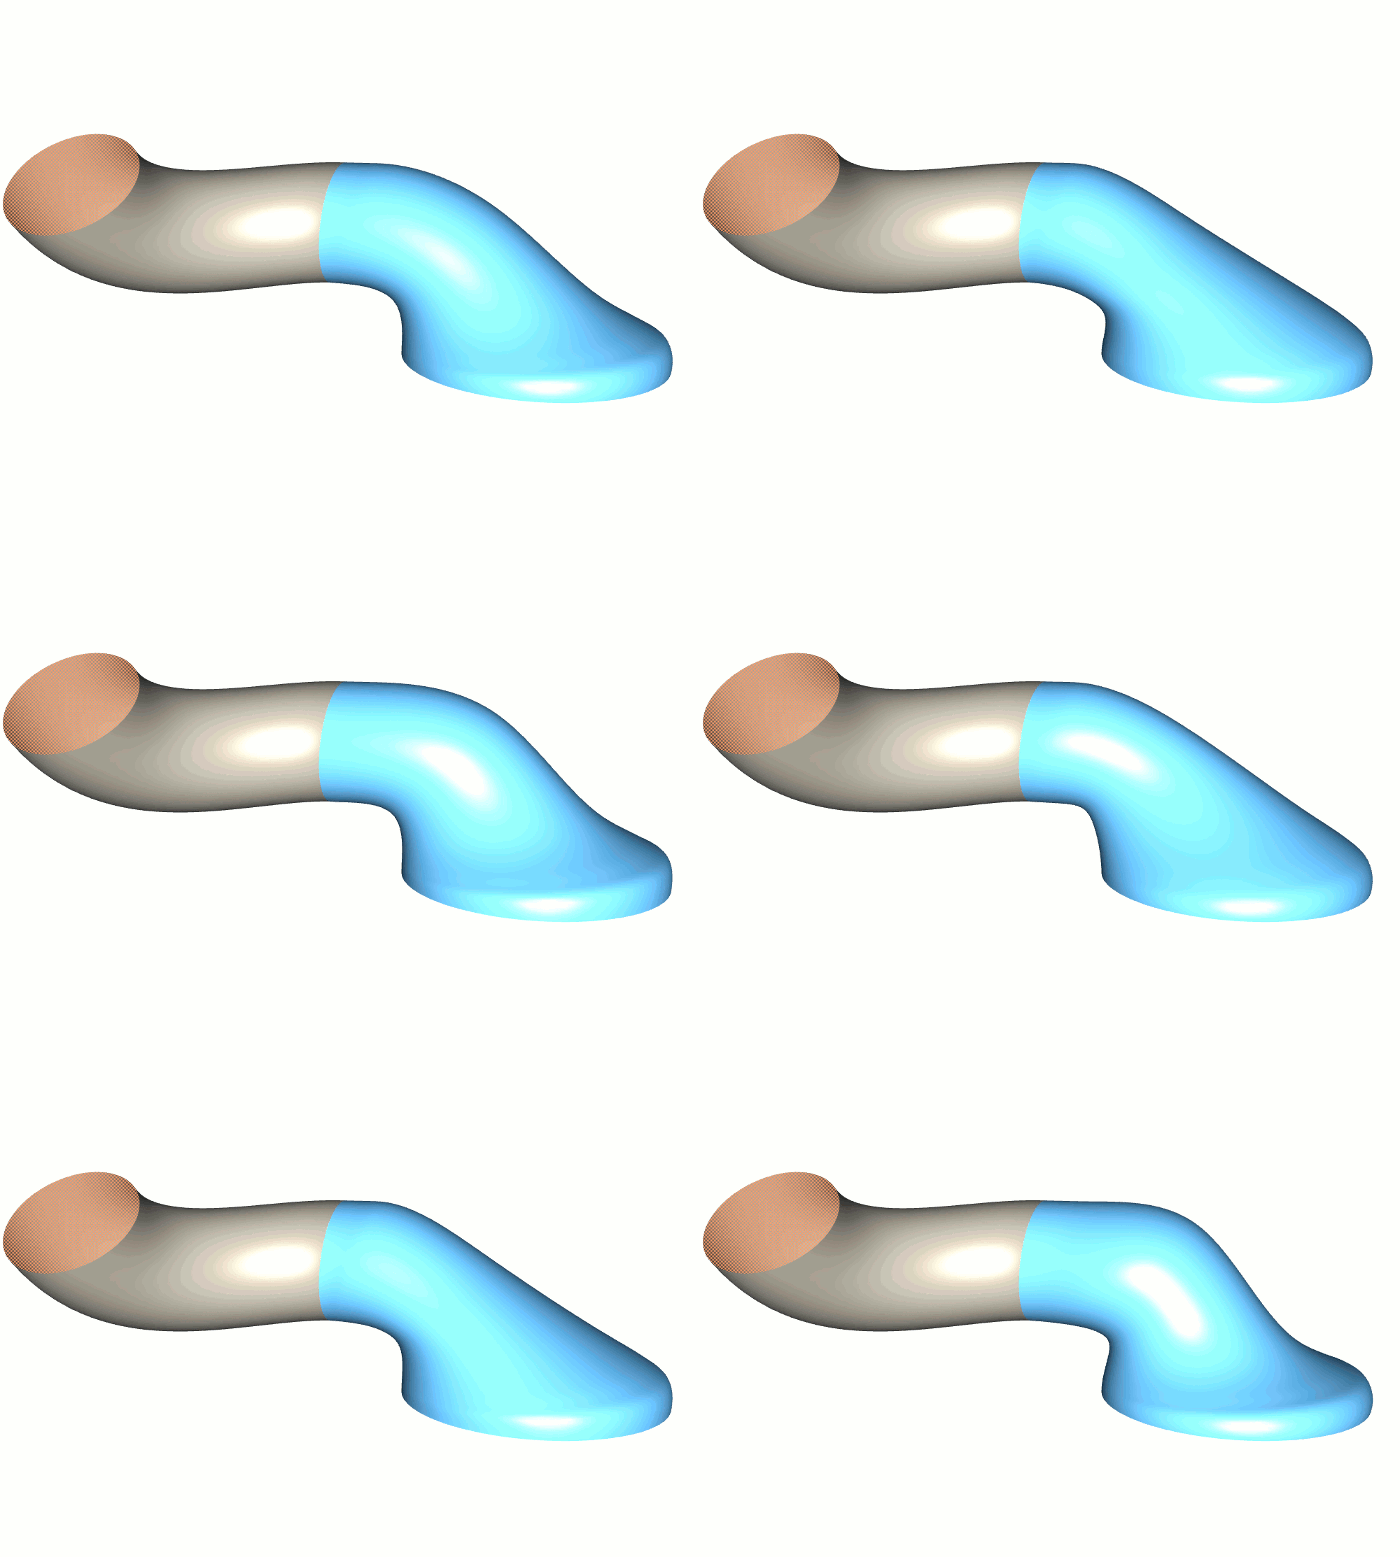
Automated Shape Changes of the Duct
Meshing and Flow Analysis
One of the key benefits of using GridPro is that a flow-aligned structured mesh can be generated quite easily, and it also adapts automatically to a change in the geometry. The output mesh can be directly converted to the OpenFOAM format, and all of these GridPro commands are simply written into a shell script so that it can be automated right away.
For the OpenFOAM CFD setup, we used a compressible gas and involved a porous media for the catalytic converter. The control files of OpenFOAM were set up according to the customer requirements (mass flow, temperature etc.). The OpenFOAM execution was again written into a shell script so that everything was ready for batch-mode automation.
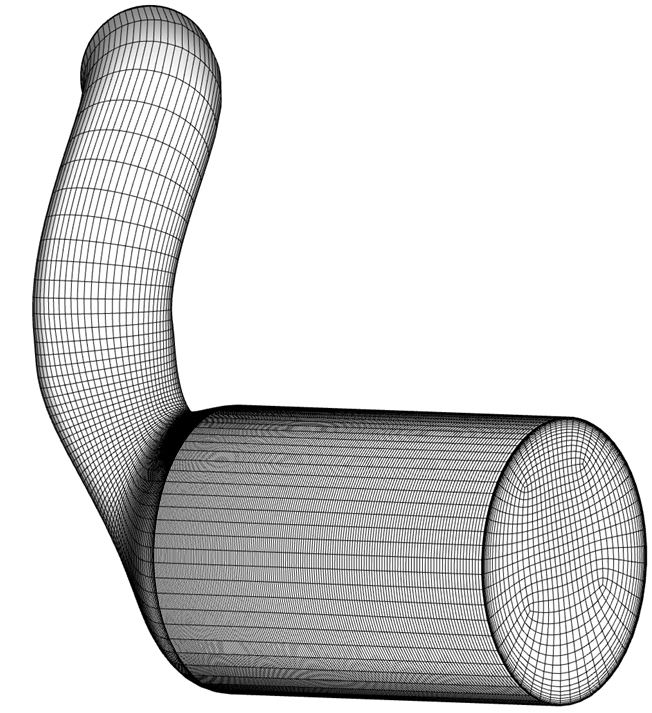
Use of Porous Medium
Automation and Optimization
Since the meshing and CFD process is controlled by shell scripts and the OpenFOAM control files, we could create a software connector in CAESES®, to integrate and automate the entire process through the CAESES® user interface. The control files (dicts etc.) were loaded into CAESES®, and parameterized for direct control of the settings. For an easier assessment, we also visualized the 3D flow data in the user interface of CAESES®, using the VTK output data from OpenFOAM.
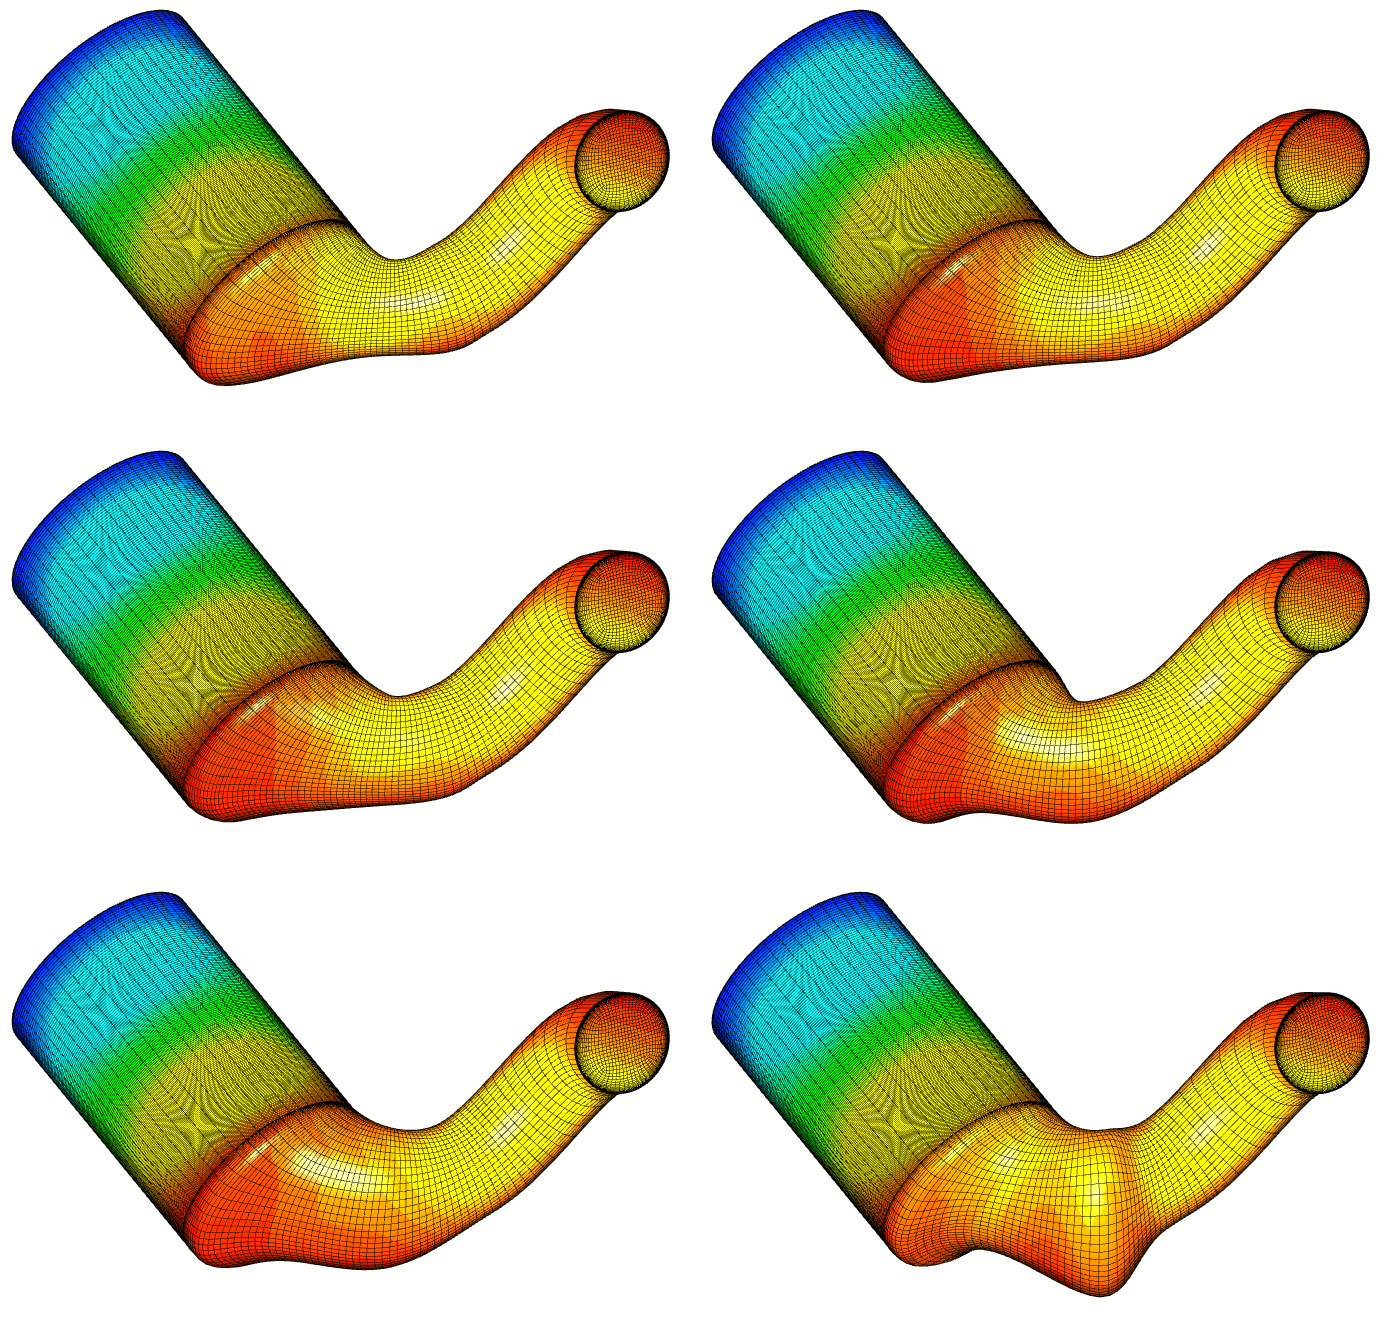
Visualization of Pressure Distribution in CAESES
The design viewer in CAESES® was also used for side-by-side comparisons of the generated design candidates. This usually includes geometry screenshots and the 3D geometry itself, but also typical CFD results such as convergence plots for each design. With such an overview and the data from the result table, it is easy to finally pick the best candidate with maximum flow uniformity.
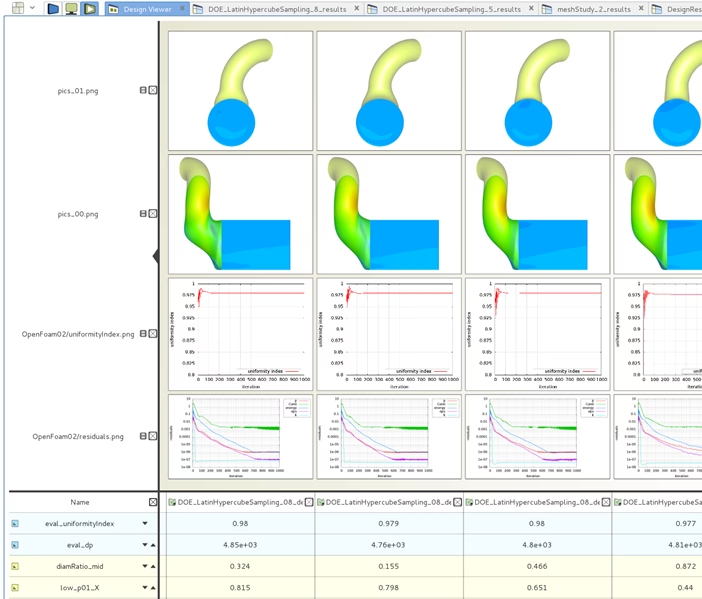
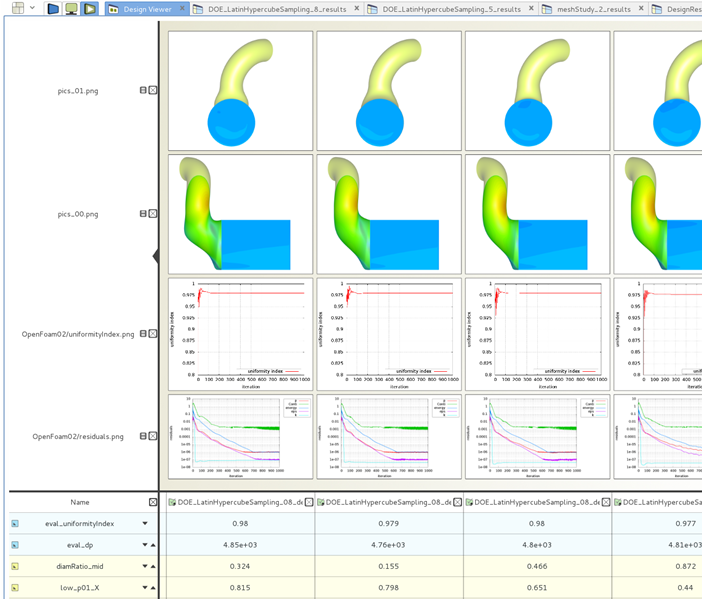
Design Viewer for Side-by-Side Comparisons of Relevant Data
Results
The pressure loss was also taken into account in this project, at least up to a certain extent for finding a good compromise between flow uniformity and pressure loss. As a result, we gained about 2.1% improvement for the uniformity, while further reducing the pressure loss by 5.5%.