Early-stage system-level optimization of a fast planing monohull
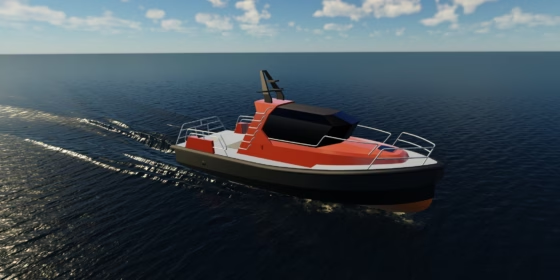
The advantages of early-stage Design Space Exploration (DSE) are well recognized within the fast-ship design community. By evaluating design variations in the process, DSE can significantly influence both fundamental design and business decisions, and enhance the effectiveness of later simulations that rely on resource-intensive, higher-order methods.
This study is a collaborative effort between HydroComp Inc. and FRIENDSHIP SYSTEMS AG. It was presented at the SNAME FAST 2025 Conference, and serves as an extension of the AutoPlan R&D project, which included viscous CFD analyses, towing tank experiments, and full-scale sea trials.
In AutoPlan, the optimization of an 11-meter planing craft operating at 27.5 knots was performed using high-fidelity tools such as RANS-based CFD (Simcenter STAR-CCM+). While these methods provide highly detailed and accurate results, they are computationally expensive and time-consuming, making them less suitable during conceptual design stages.
This raises the central question:
Can faster, reduced-order simulation tools be used to effectively explore the design space with enough confidence to support informed design decisions?
To answer this, the study follows the same design process used in the AutoPlan project, allowing side-by-side comparisons of outcomes and resource requirements, and replaces the high-fidelity CFD simulations with a resource-efficient, reduced-order workflow using CAESES® for parametric hull design and NavCad® for early-stage performance prediction.
Methodology
The table below summarizes the methodology followed in this study for comparing the outcomes and resource requirements of the AutoPlan project:
| Parameter | FC-DSE (Fully-Computational) | SERO-DSE (Semi-Empirical) |
| Simulation Tool | RANS CFD (STAR-CCM+) | HydroComp NavCad |
| Hardware | HPC cluster (40 cores, 90GB RAM) | Business laptop (Intel i7, 32gb RAM) |
| Time per Variant | ~2.5 – 5hrs (depending on vessel configuration) | ~30 seconds (600x faster) |
| Key Differences | Secondary performance characteristics | Broader perspectives, full system simulation |
FC-DSE
FS-DSE uses a simplified force model that excludes appendages and does not account for propeller-induced forces.
Computation is performed at model scale to reduce computational cost, and full-scale values are obtained using a nonstandard expansion method, in which power is treated as an exponential function of the scale ratio.
SERO-DSE
SERO-DSE uses a more complete force model that includes lift from appendages and propellers, as well as spray drag. Computation is performed at model scale using dimensional analysis of model test data, and expansion to full scale is carried out through a combined Froude and Reynolds scaling approach.
Obviously, both approaches represent simplified models of reality. Neither is fully correct, and each is an approximation that is useful in different ways. The distinction lies between the data model, which defines how the hull and forces are represented and applied, and the analytical model, which defines how the calculations themselves are performed.
Validation
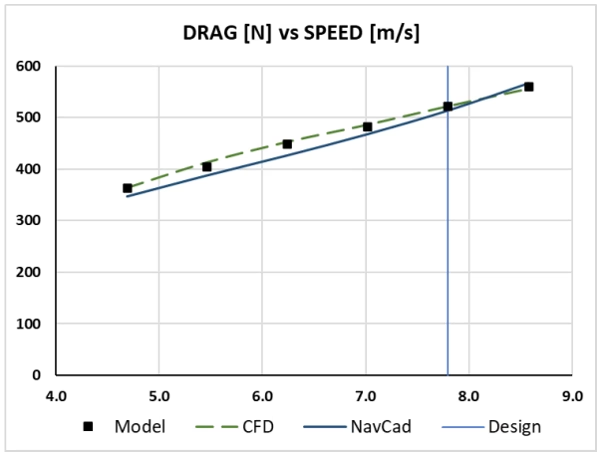
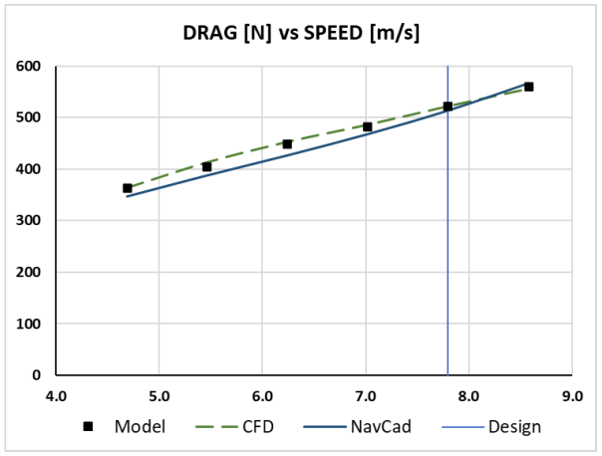
Of course, speed is useless without accuracy, so the first step was validation. The NavCad predictions for the baseline hull were compared with the original model test data and CFD results. As shown in the drag curve, the predictions are in very close agreement, especially at the design speed, providing strong confidence in the workflow.
Data Flow
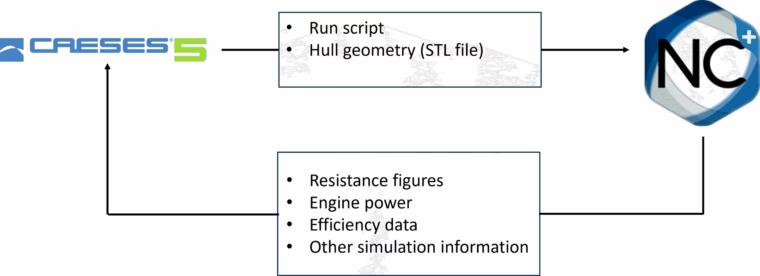
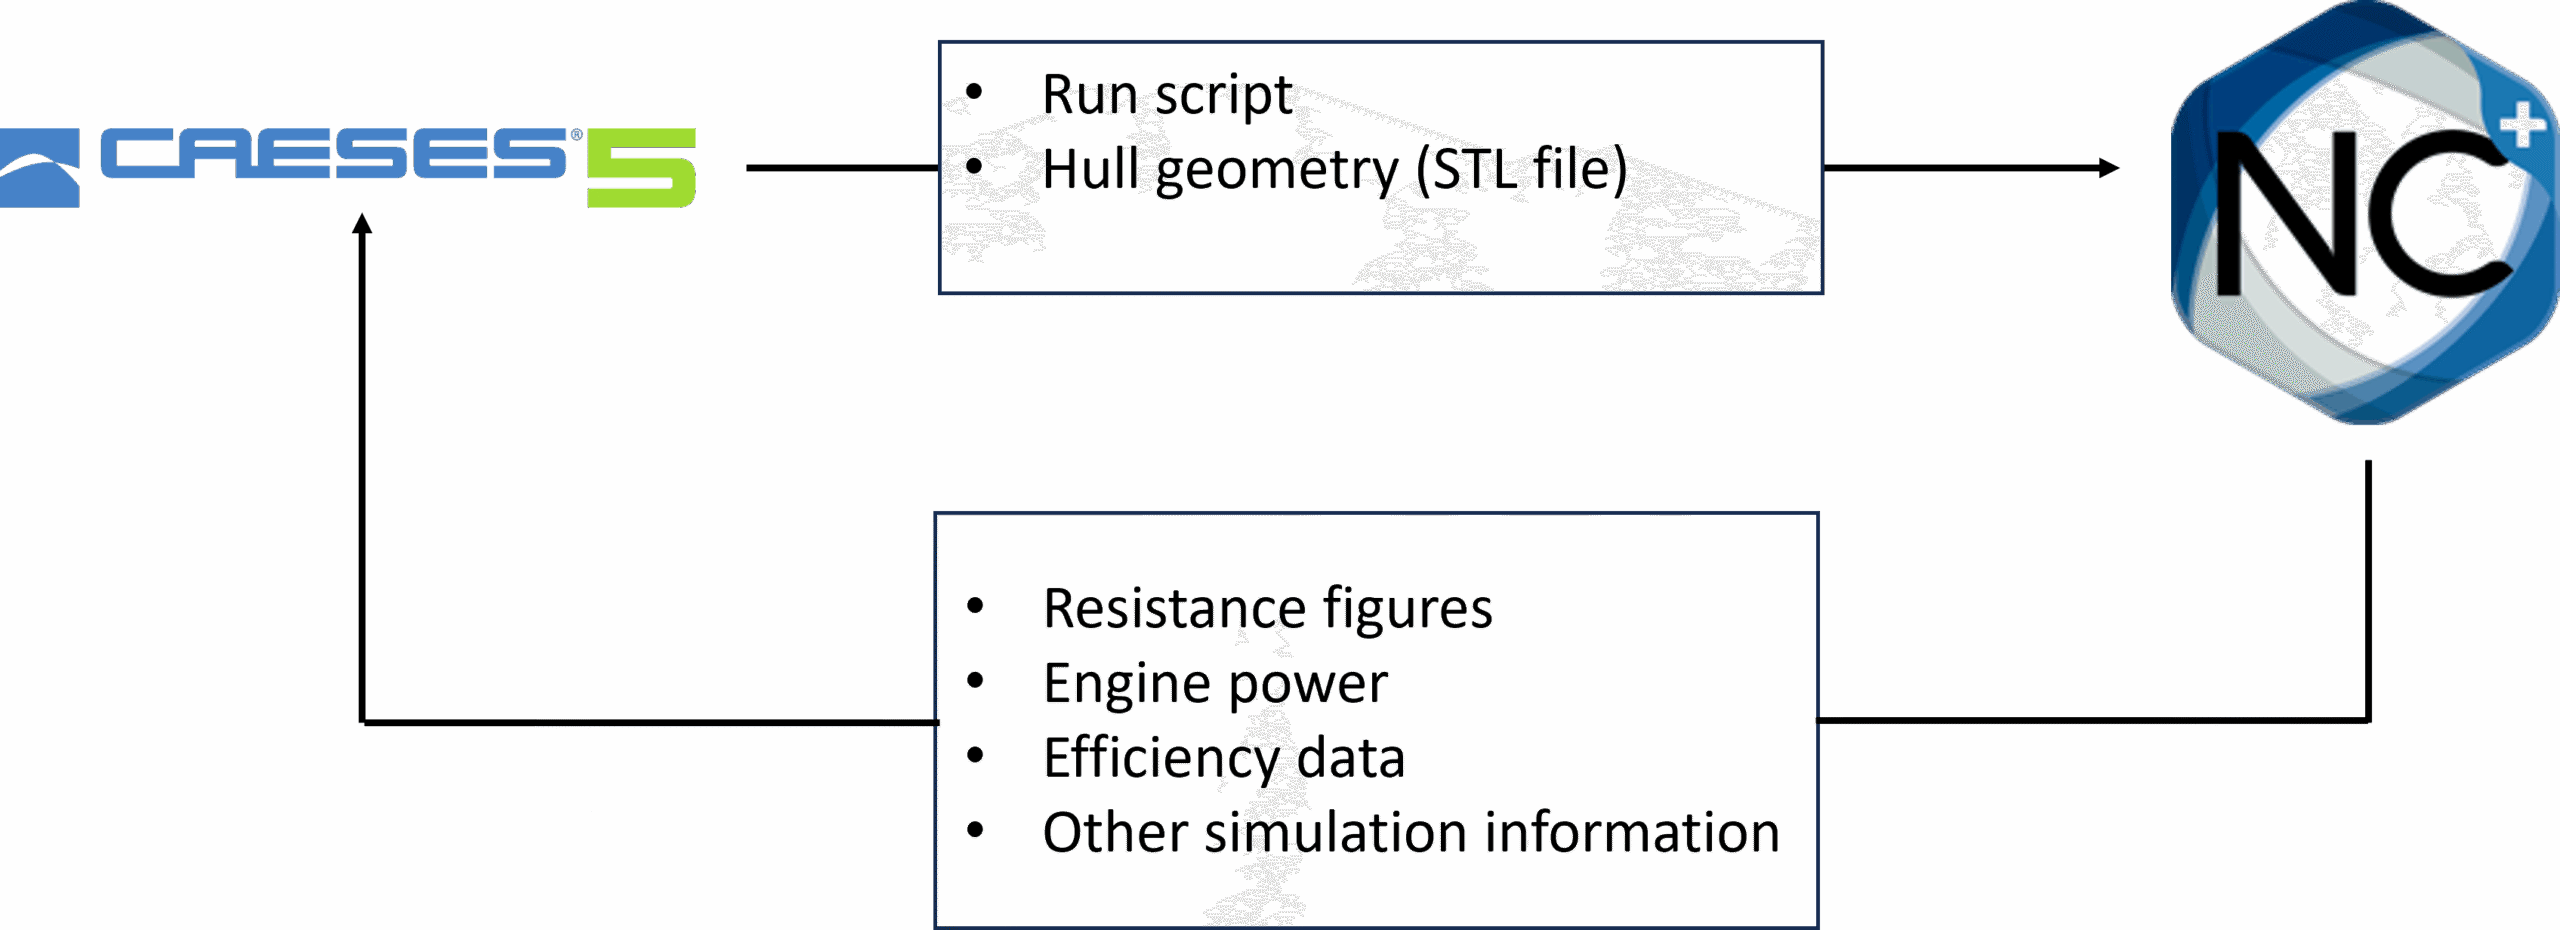
As shown below, the connection setup between CAESES and NavCad illustrates how data flow is managed and exchanged between the two software packages using batch scripting. Parametric modeling is carried out in CAESES, which triggers the simulation process, while NavCad performs the corresponding calculations and returns the resulting performance outcomes.
Parametric Model in CAESES
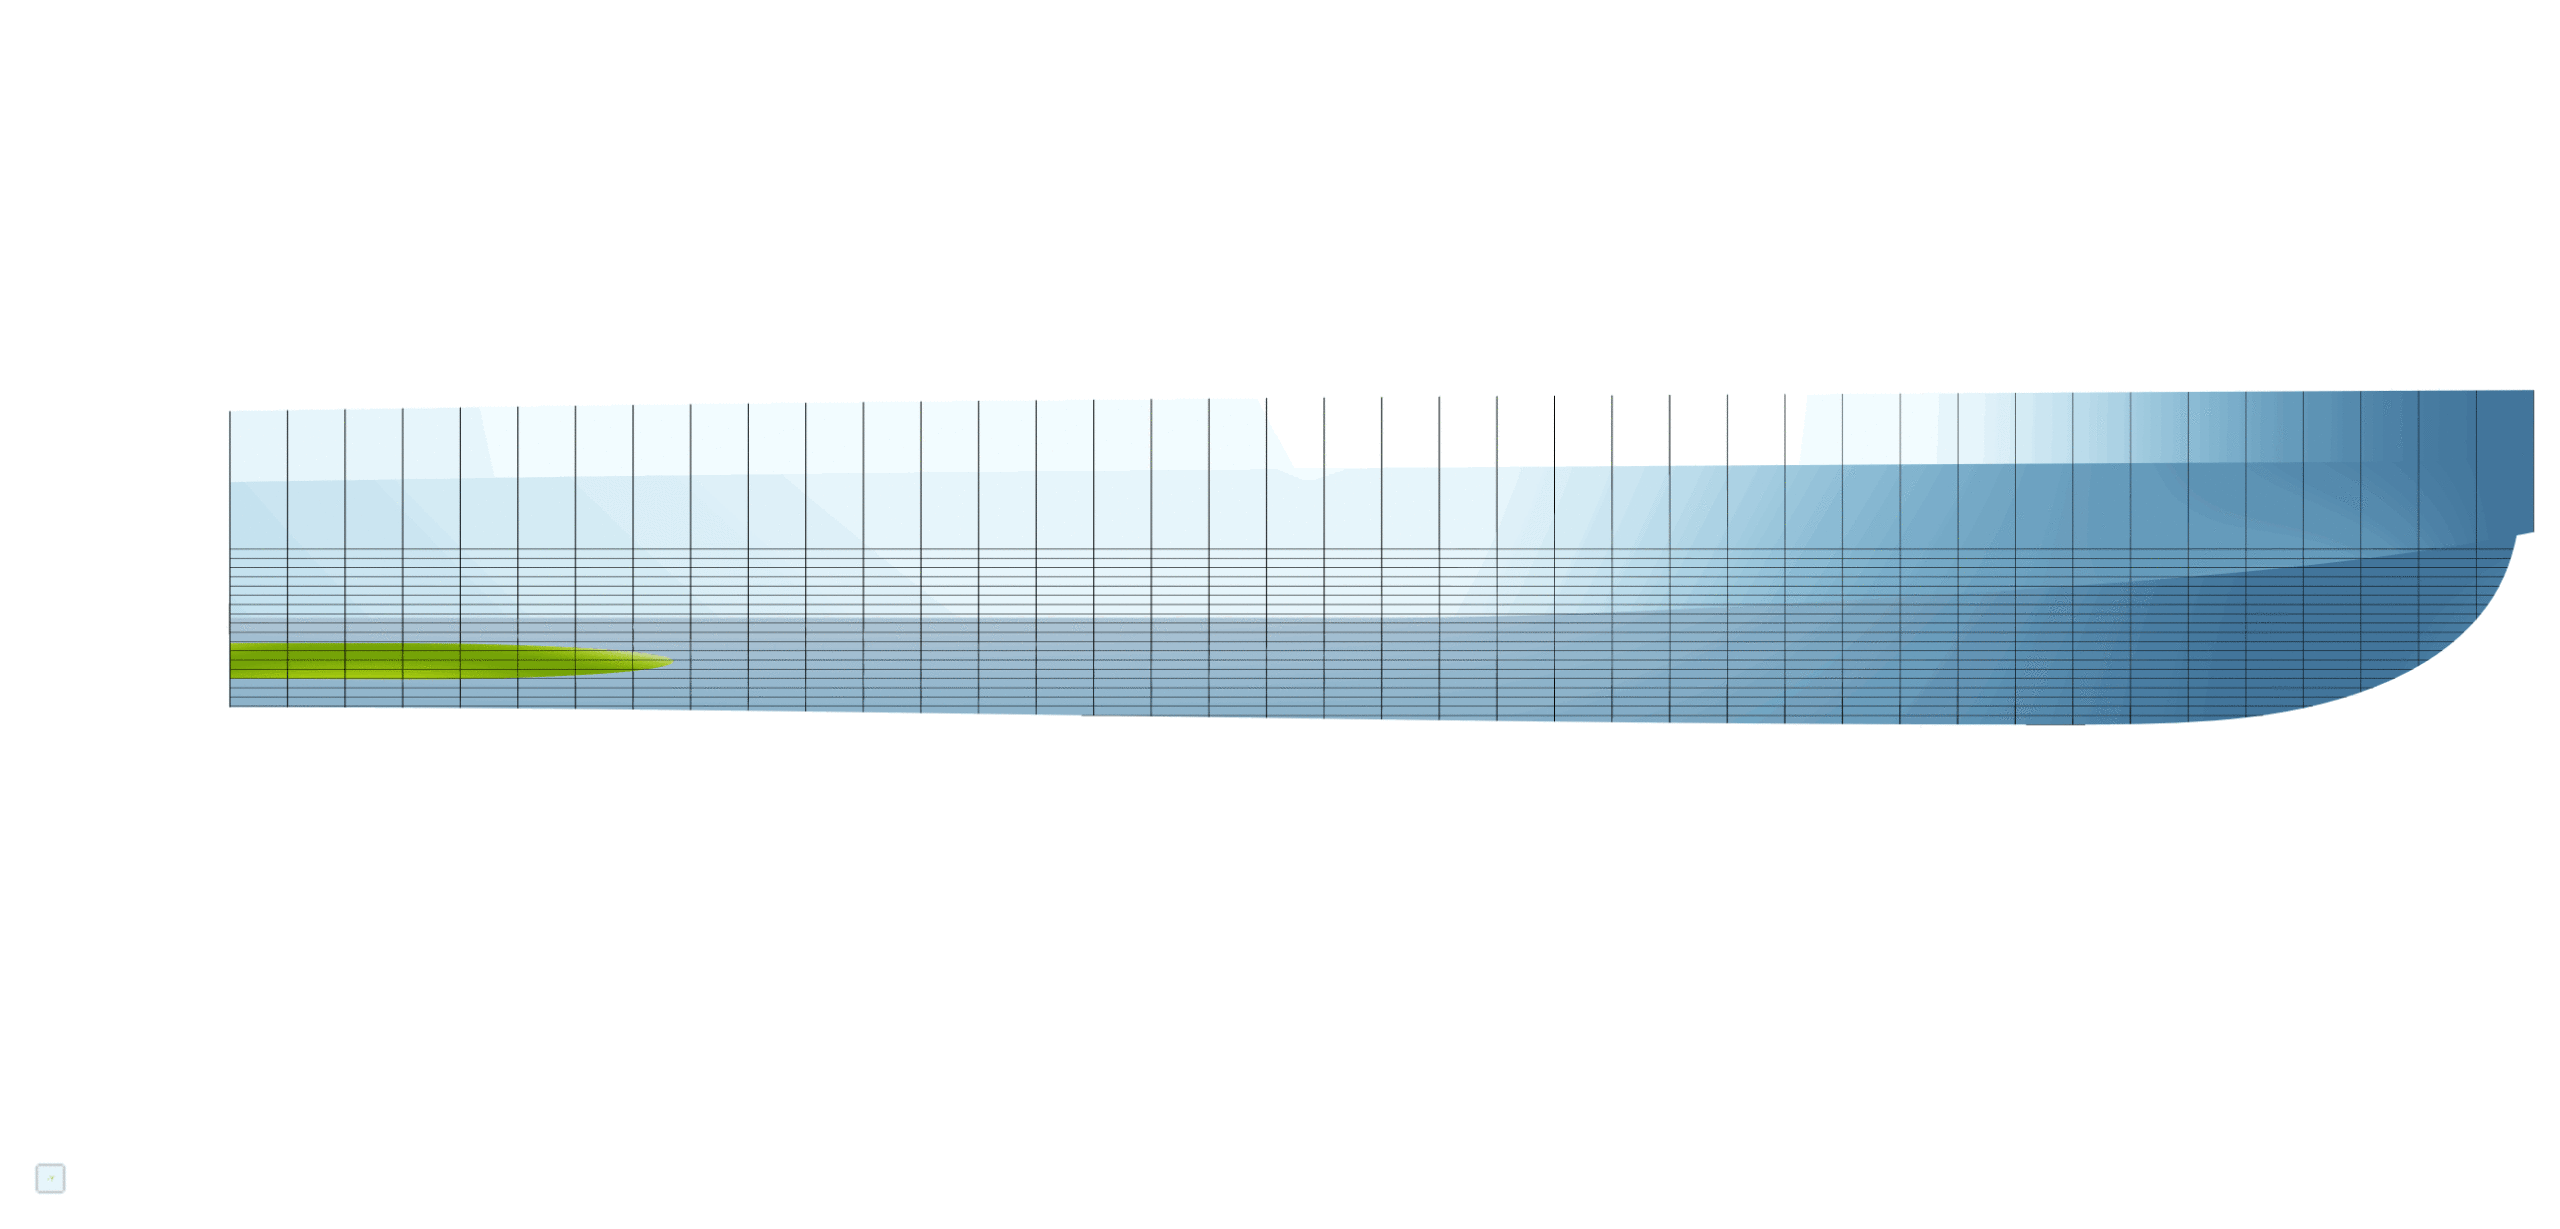
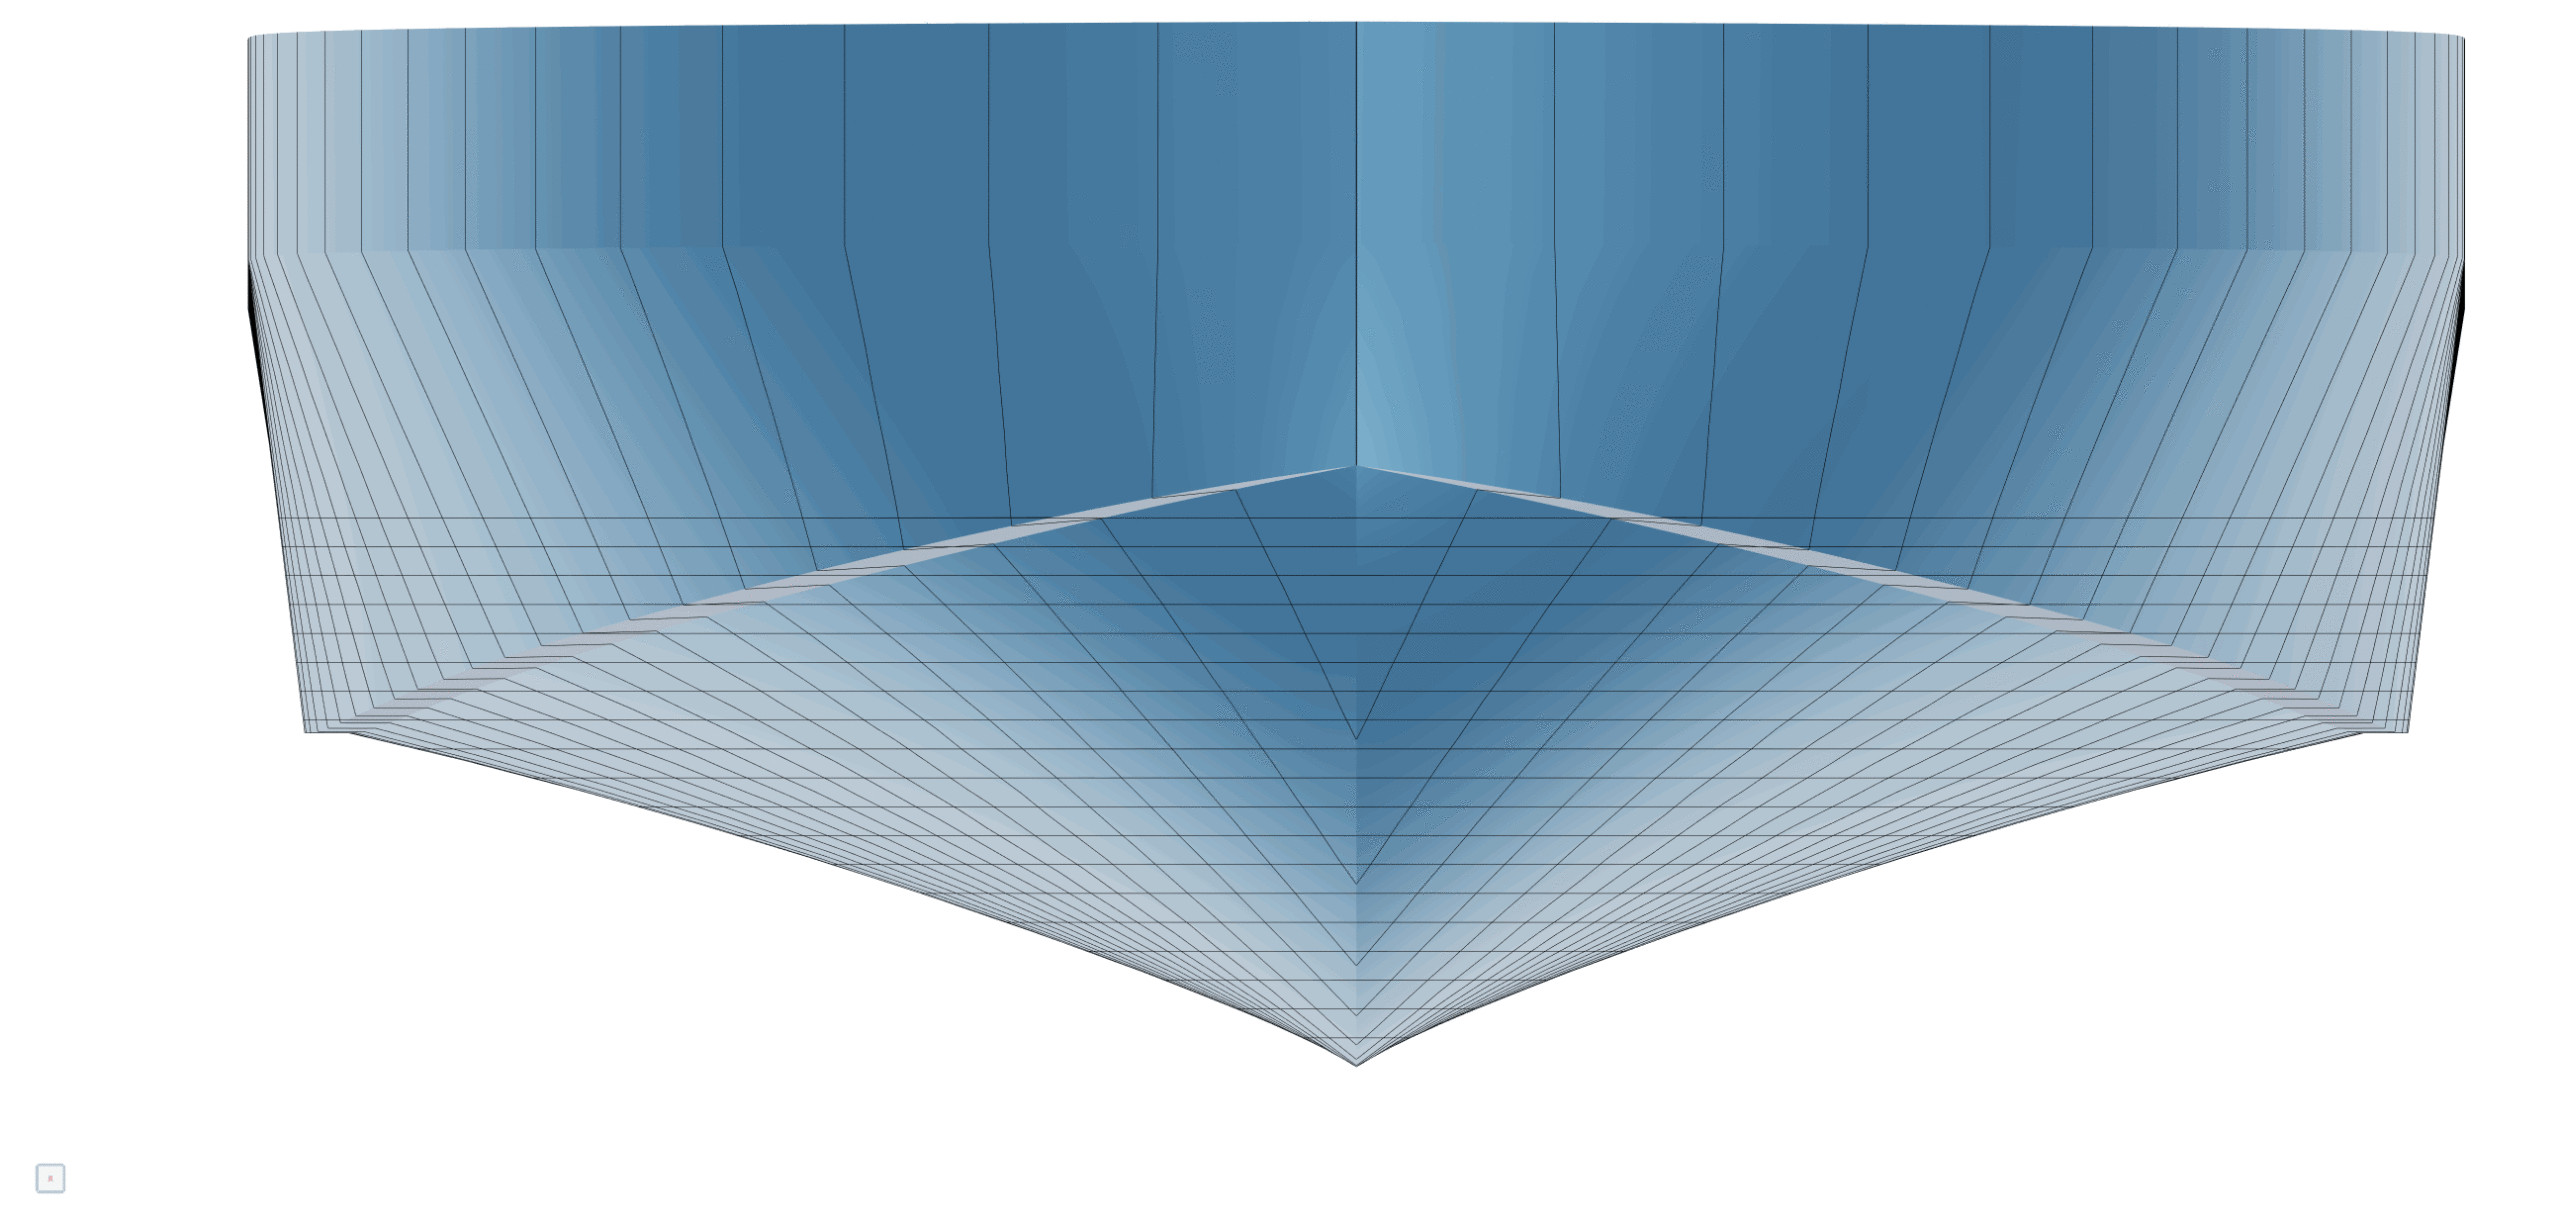
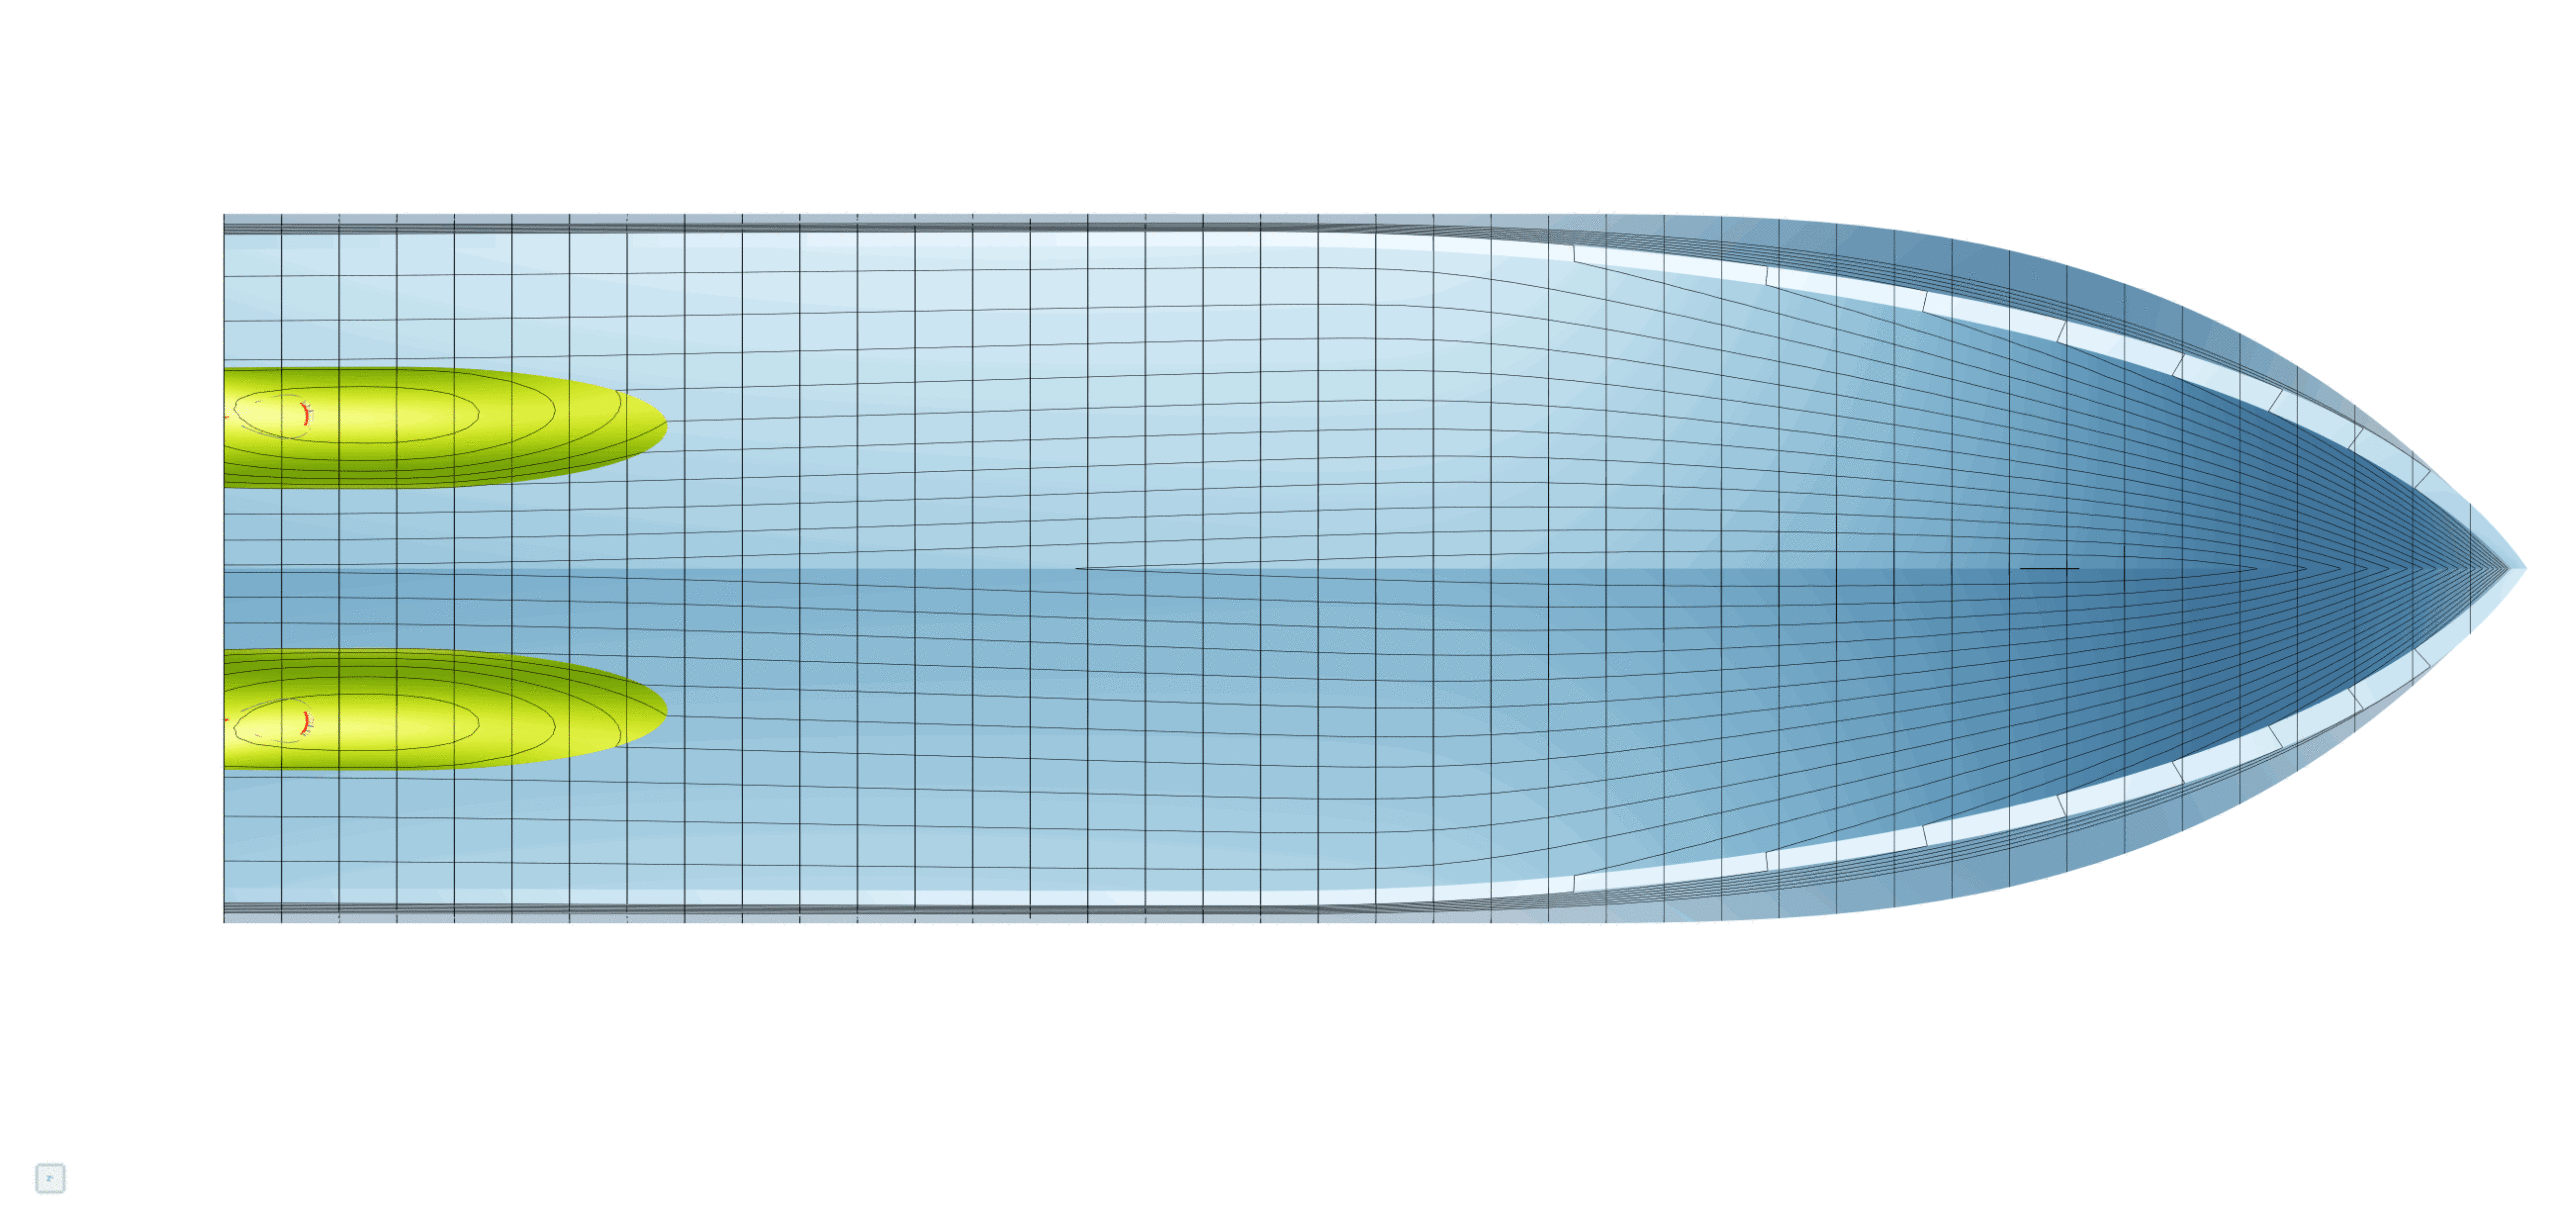
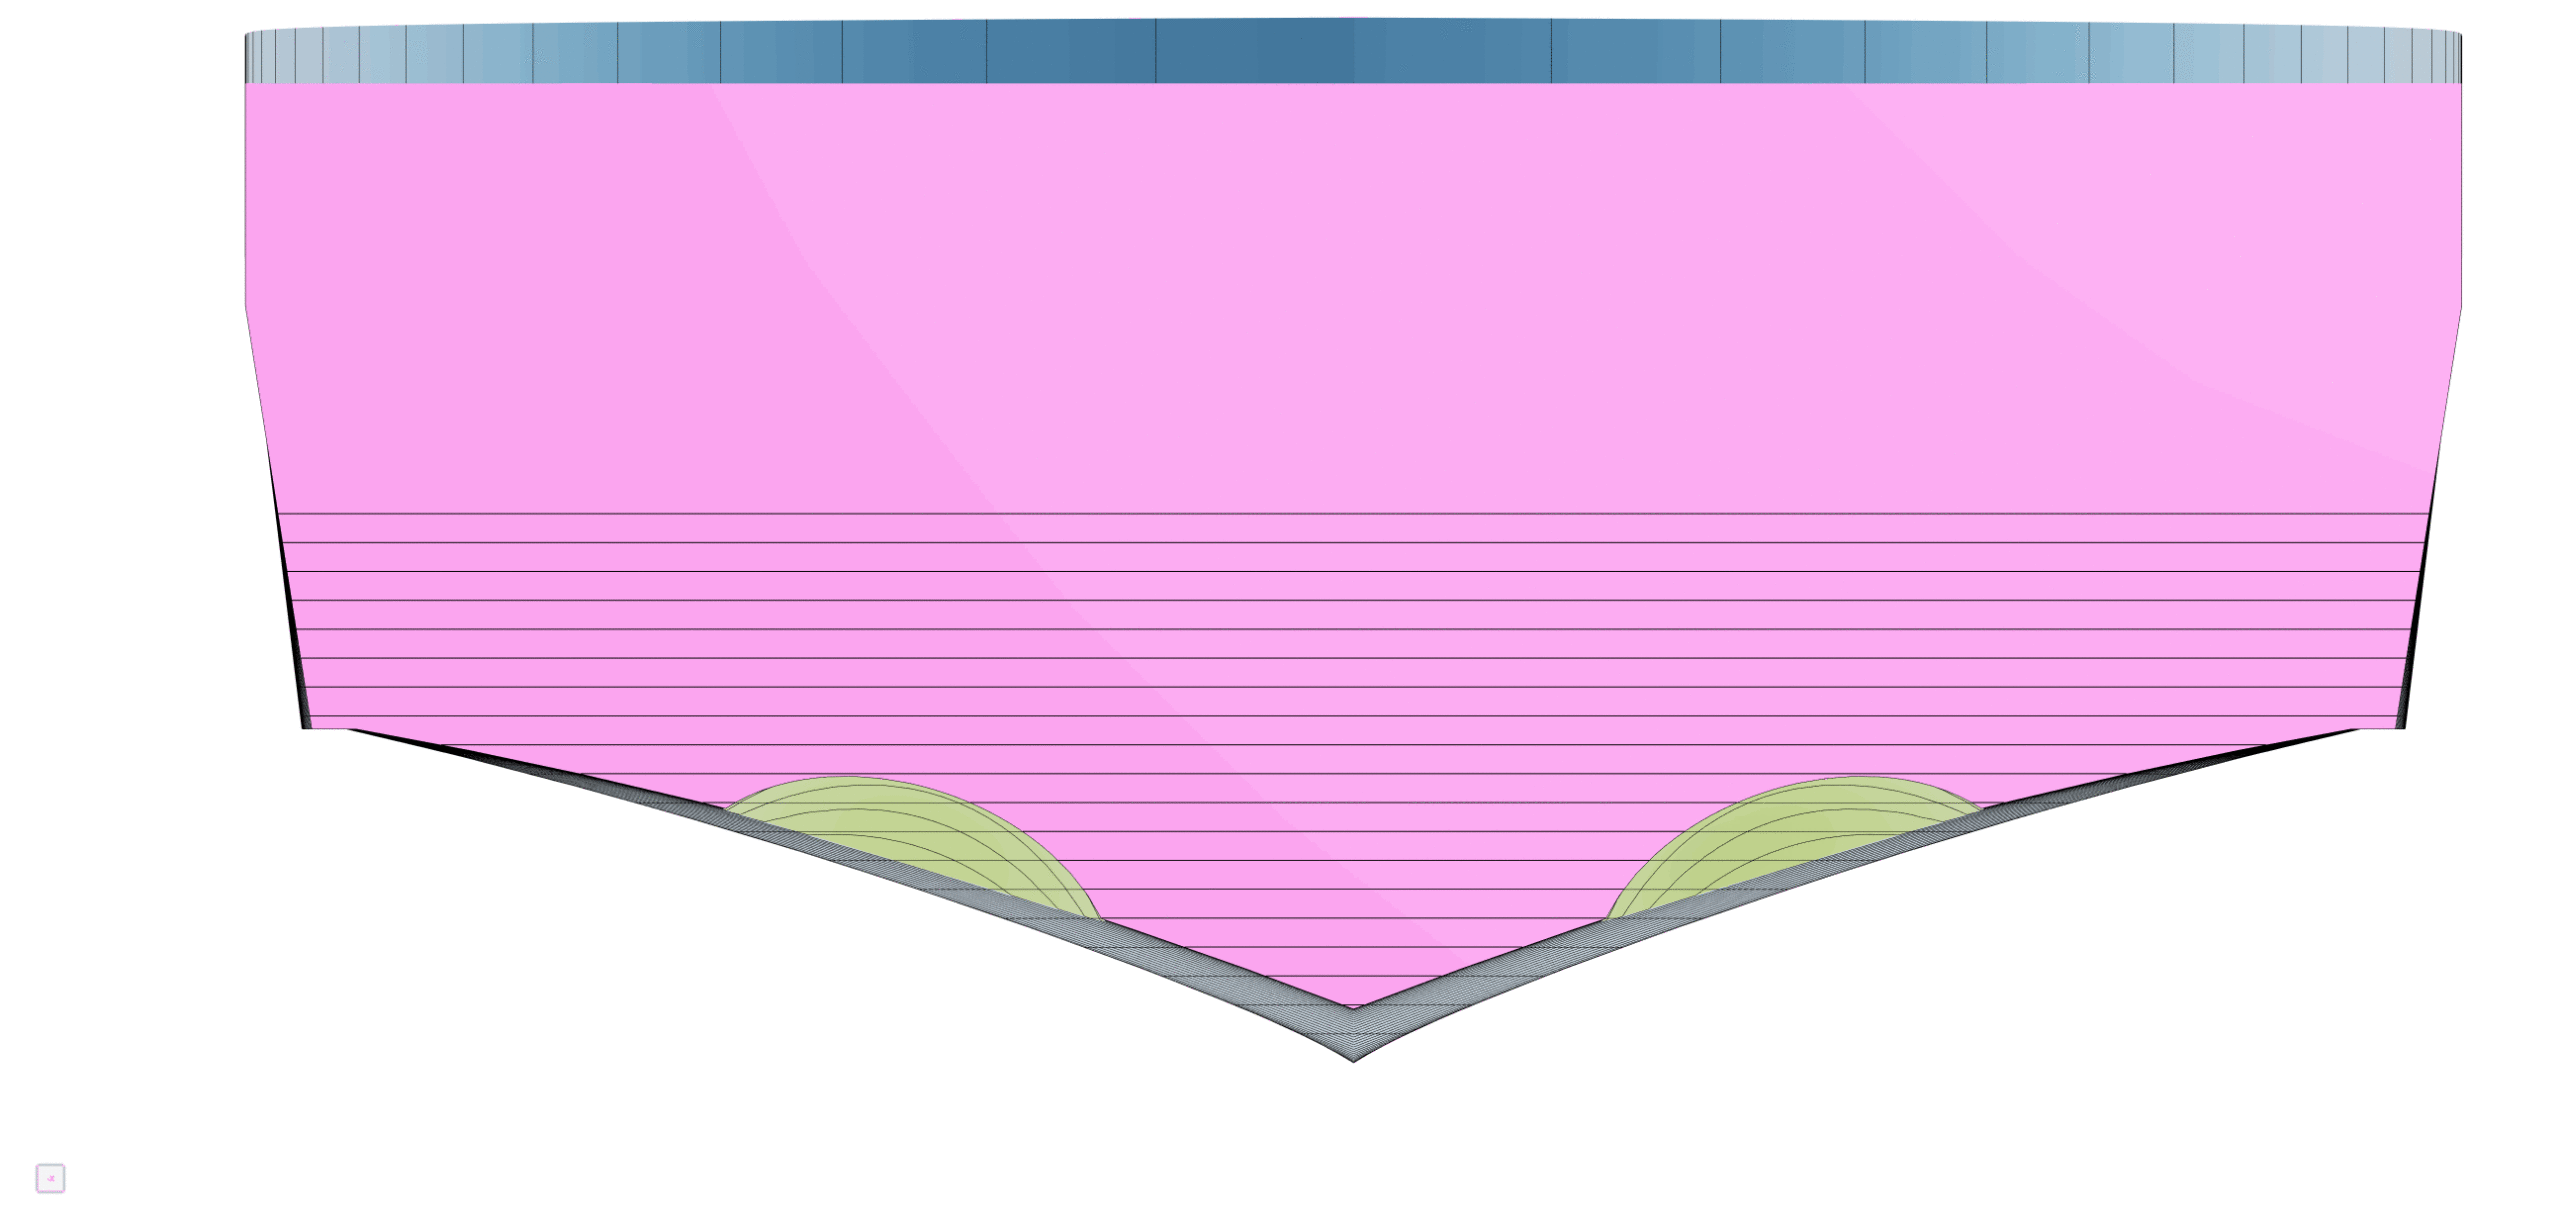
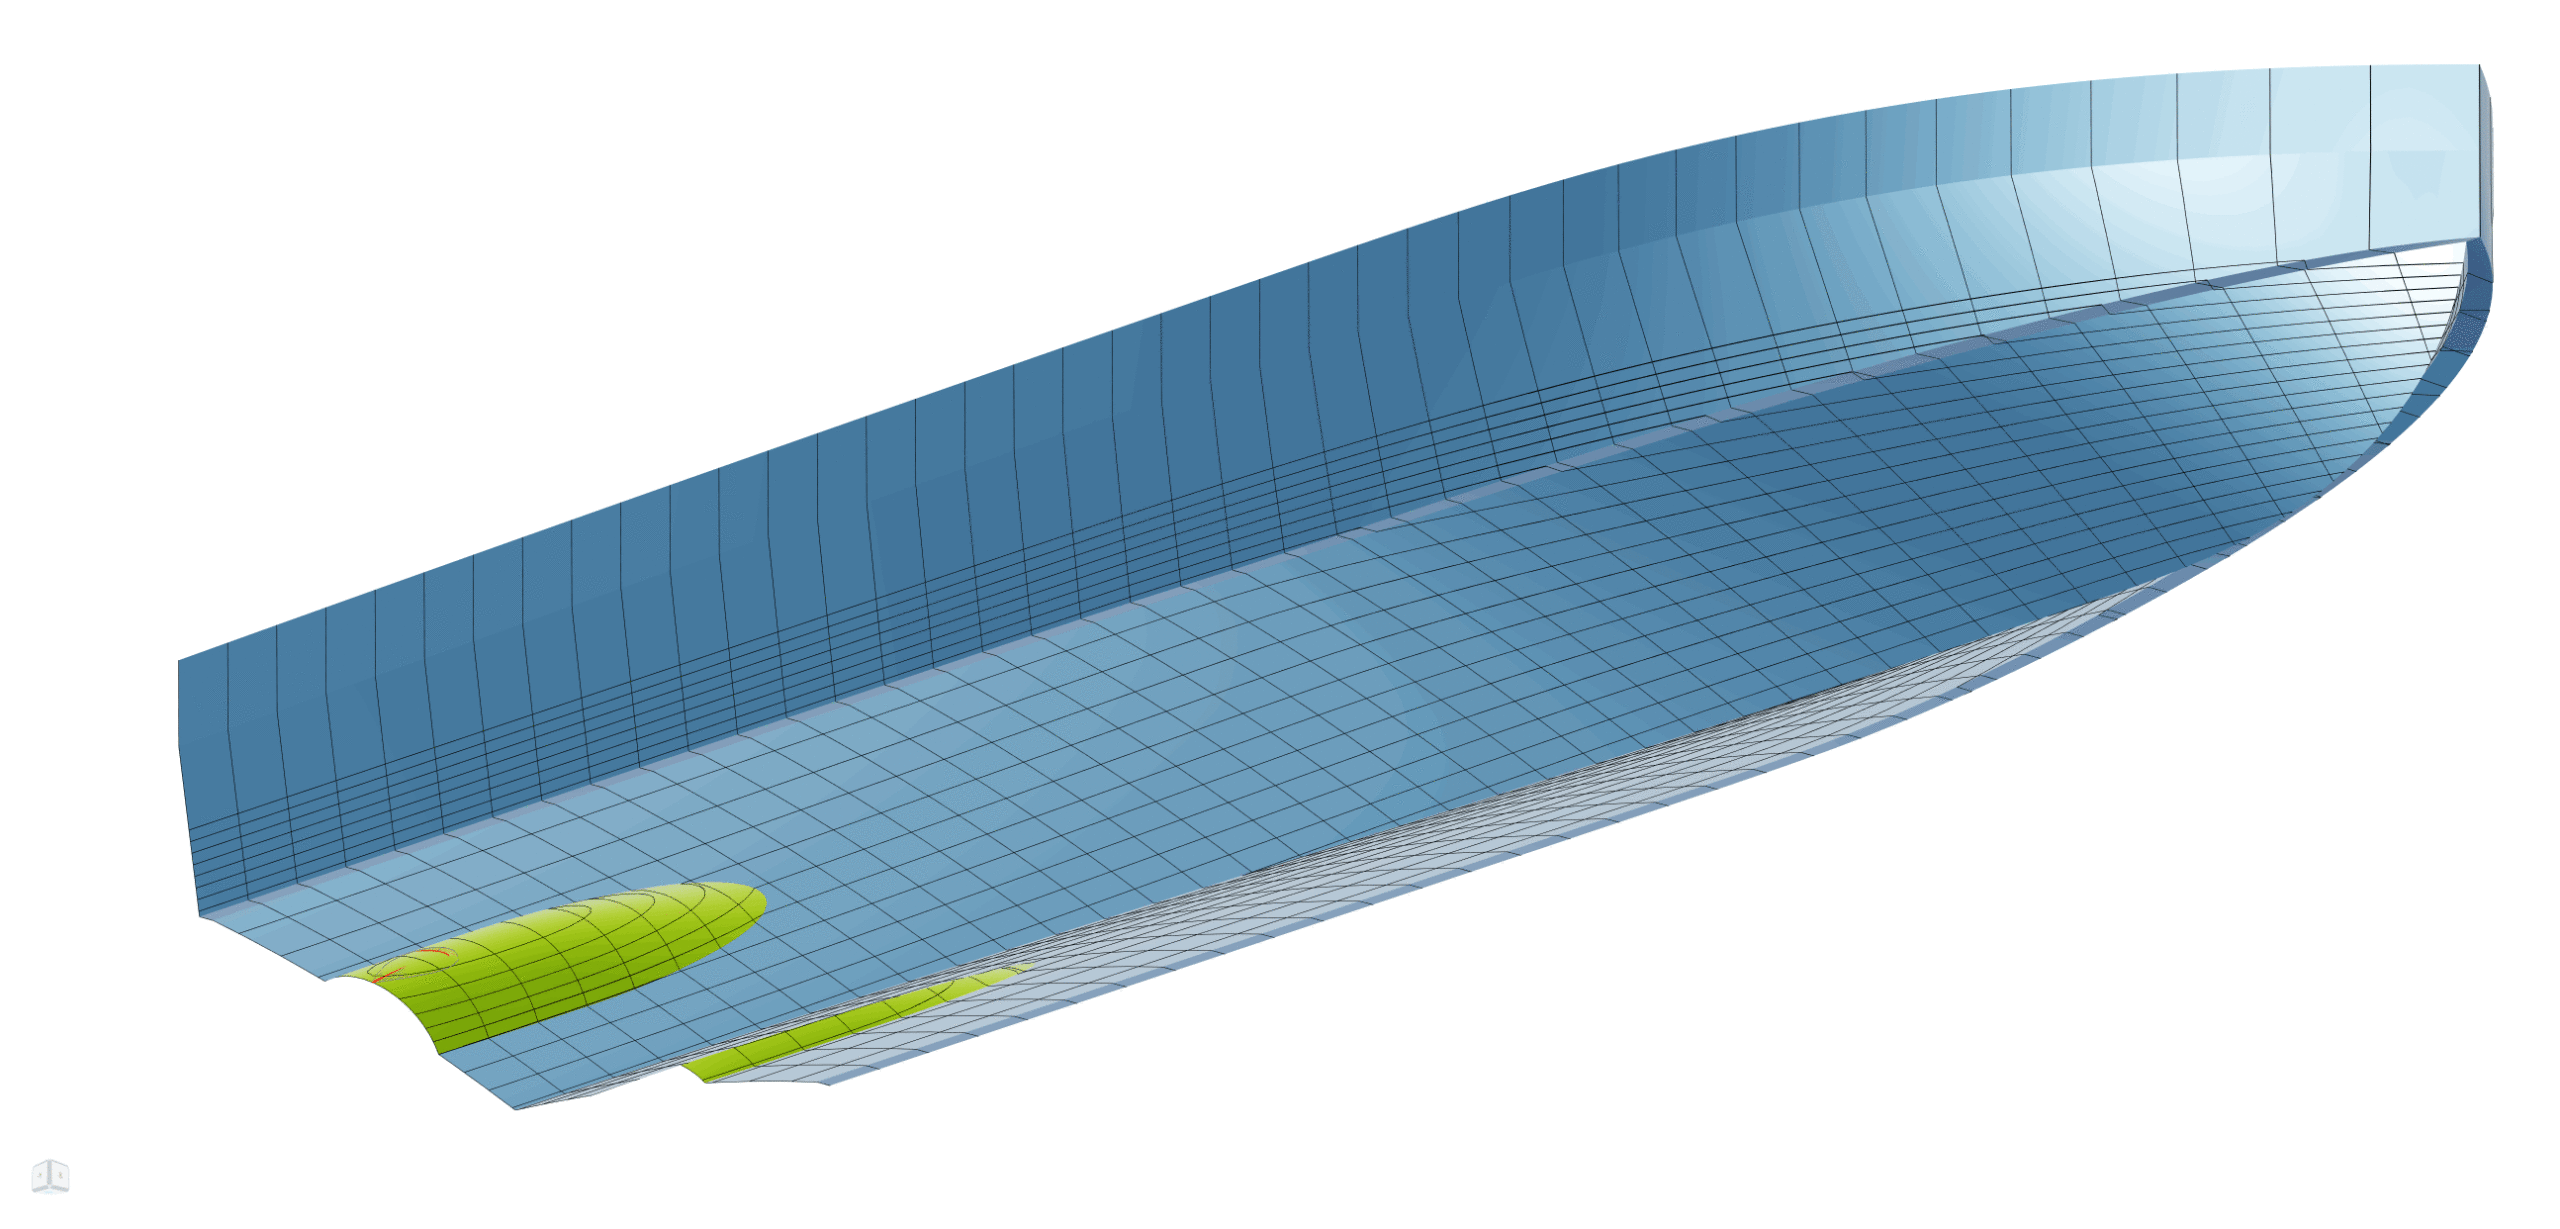
A parametric model, using the same parametrization employed in the AutoPlan project, was developed in CAESES. The animations below illustrate the design space and the range of design variables explored.
The NavCad Simulation
Regarding the NavCad simulation, it is useful to look briefly under the hood at how the system operates.
Resistance Prediction
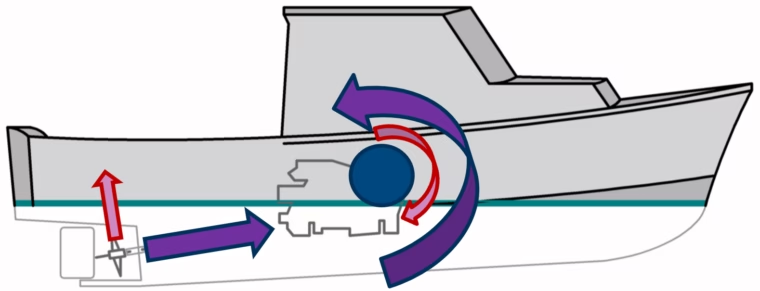
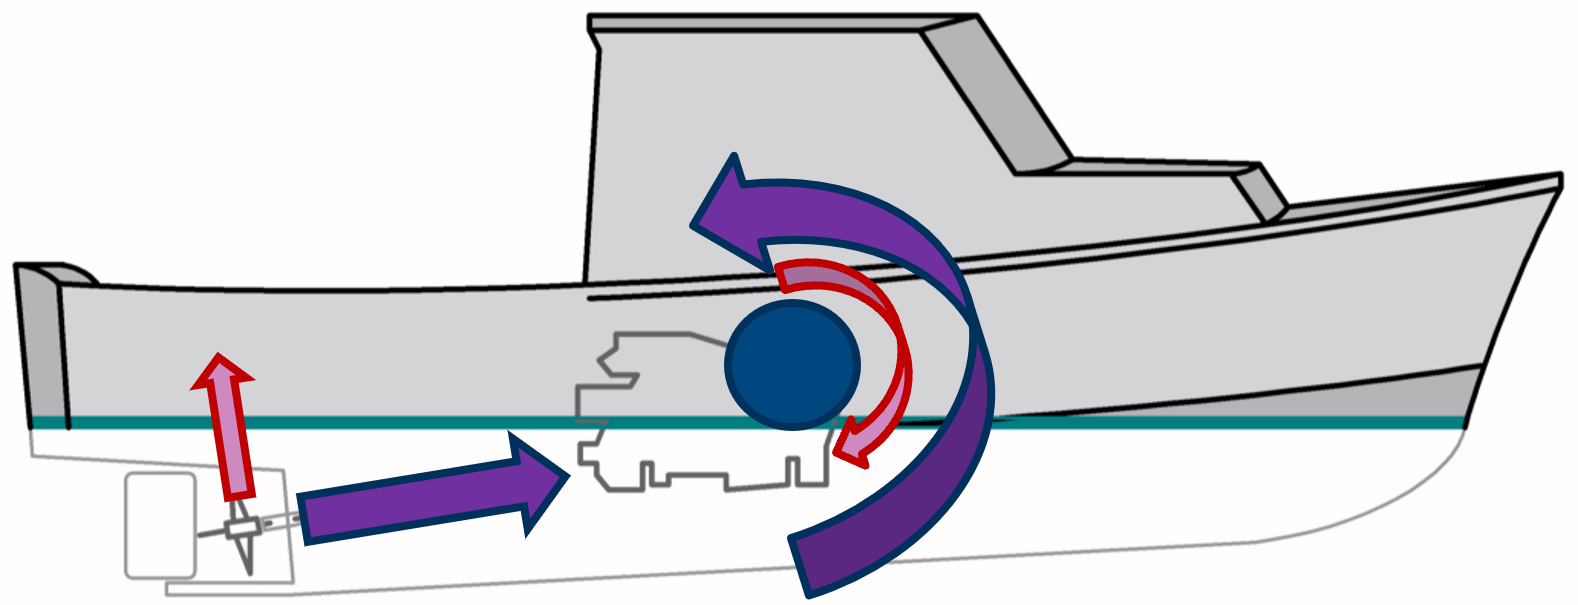
Resistance is computed using an equilibrium method based on the well-known Savitsky (1964) planing theory, which has been enhanced with modern extensions that account for hull tunnels, spray drag, and bow-wave formation. A key component is the propulsor lift model, which captures the vertical forces generated by the shaft line described earlier.
Propulsion Simulation
Propulsion is handled through a more advanced process than a single, fixed calculation. For each hull variant, the simulation performs its own sub-optimization to determine the ideal propeller configuration for that specific design. This approach ensures a fair, like-for-like comparison of the best achievable performance for every hull. Performance is then evaluated using a steady-state equilibrium condition in which thrust and resistance are balanced.
The Optimization Process
Since the modeling phase, simulation phase, and connection setup are covered, an automated loop can be applied, enabling design space exploration and optimization driven by CAESES.
Design of Experiments (DoE)
A Sobol sequence was used to efficiently explore the design space and identify key relationships between hull parameters and performance.
Local Optimization
A T‑search method was then used to refine the most promising variants identified in the DoE.
Comparable Performance Gains
A direct comparison is difficult because the CFD analysis was conducted at model scale, used a simplified appended-drag model and applied a scaling procedure that differed from the standard ITTC approach. For this reason, the comparison is based on relative improvements rather than absolute values. Both paths, however, resulted in significant and similar reductions in drag and power.
Comparing relative improvement
- FC-DSE (CFD): 10.9% reduction in shaft-line thrust, which correlates directly with total drag and an 11.6% reduction in shaft power
- SERO-DSE (NavCad): 11.9% reduction in drag and a 14.9% reduction in shaft power
The difference in shaft-power improvement relative to drag is attributed to propeller sizing effects and oblique-angle correction.
Comparing Baseline with SERO-DSE Optimized
| Metric | Baseline | SERO-DSE Optimized | Improvement |
| Total Drag [kN] | 16.8 | 14.8 | 11.9 % |
| Shaft Power [kW] | 2x195 | 2x166 | 14.9 % |
Geometric Similarity
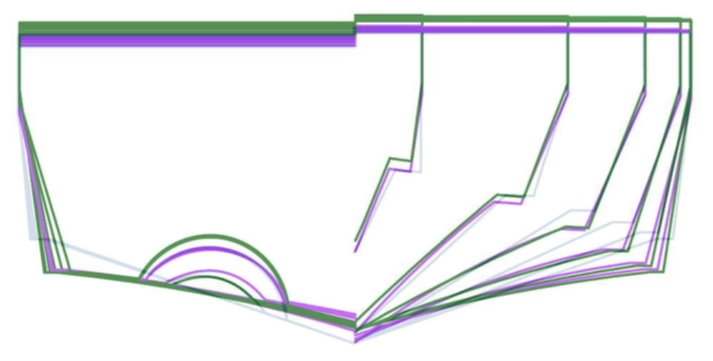
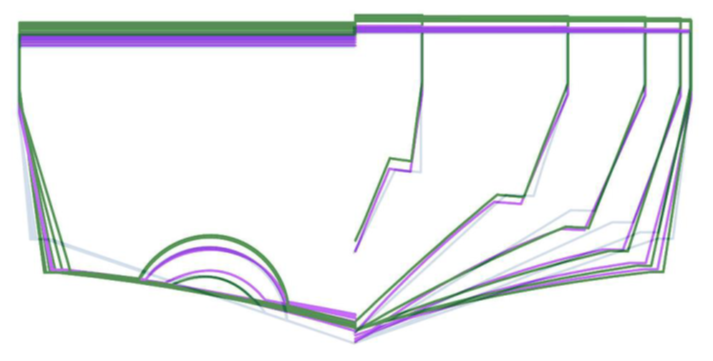
Even more compelling is that both methods produced remarkably similar final designs. The CFD-optimized hull is shown (see image below) in purple and the semi-empirical hull in green, while the ghosted blue line represents the baseline hull used for both studies. Both approaches converged on similar strategies for improving efficiency, such as narrowing the chine beam and modifying the deadrise. This demonstrates that the reduced-order tool is not only producing accurate performance estimates, but also identifying the same geometric trends.
- Chines shifted inward and downward
- Rising keel resulting in a flatter deadrise
- FC-DSE exhibits a higher static draft, driven by a narrower chine beam and increased bottom warp; the deadrise is higher forward and flatter aft
Gains in Workflow Efficiency
Putting everything together, the semi-empirical approach delivered performance gains comparable to those from CFD and produced an optimized geometry that is nearly identical. A full design-space exploration using the semi-empirical tool can be completed on a laptop in less time than it takes to run a single CFD variant on a computing cluster. This does not imply that CFD lacks value or should be ignored; rather, it suggests that CFD should be positioned later in the design process. By investing less time and fewer resources early on, fundamental design decisions can be made before committing to costly CFD analyses, ensuring that the resulting data is more relevant, more accurate, and more useful to the design team.
Conclusion and Future Work
In conclusion, this study demonstrates that semi-empirical, reduced-order simulation provides a powerful framework for early-stage marine design. It is not a replacement for CFD, but serves as a highly effective front-end filter that identifies the most promising candidates for detailed analysis. The next steps involve expanding the methodology to include off-design performance and seakeeping criteria.
Duty profile optimization
This effort will extend the focused design-point optimization to include performance at off-design speeds. By defining a time- or distance-based duty profile, the objective function can be formulated as total mission fuel consumption, accounting for partial-load efficiencies of internal-combustion engines and electric motors.
Observation of additional performance parameters
Although efficiency at speed is typically a key optimization metric, the optimum design may or may not satisfy other critical criteria. It is therefore important to incorporate additional performance parameters into the optimization process. These include longitudinal and transverse dynamic stability (such as porpoising) and seakeeping characteristics (such as impact accelerations in irregular seas).
Refinement of shape parameters
A new prediction model for stern lift associated with propeller-tunnel aft-exit curvature is currently under development.
The full paper that was presented at the FAST 2025 conference is available from SNAME here.