

.jpg.6e878fdd5ff6dbaa28f6688feebf1862.jpg)
Andreas Arapakopoulos
-
Content Count
21 -
Joined
-
Last visited
-
Days Won
1
Posts posted by Andreas Arapakopoulos
-
-
Hi Adrián,
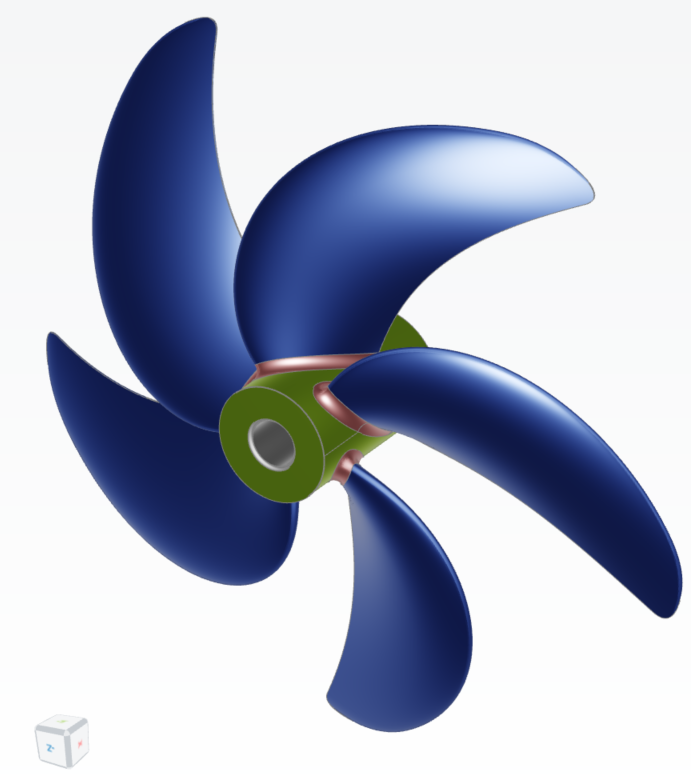
Please find the updated project attached, with the tip applied to all blades.
I created a BRep of the blade and its tip, then added a feature named periodic_BRep and rotated the BRep accordingly.
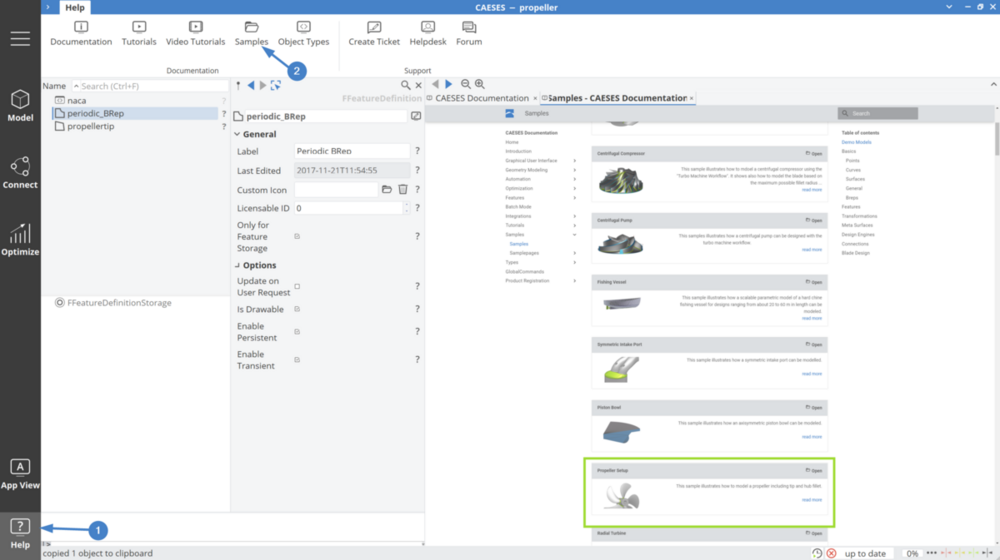
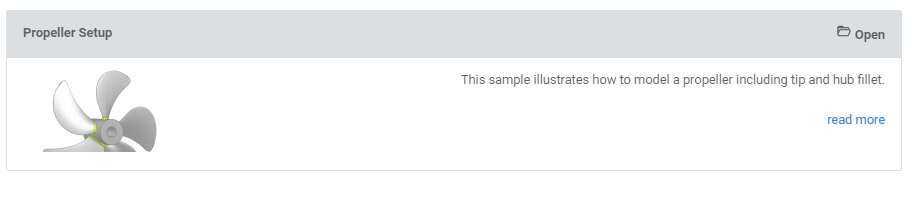
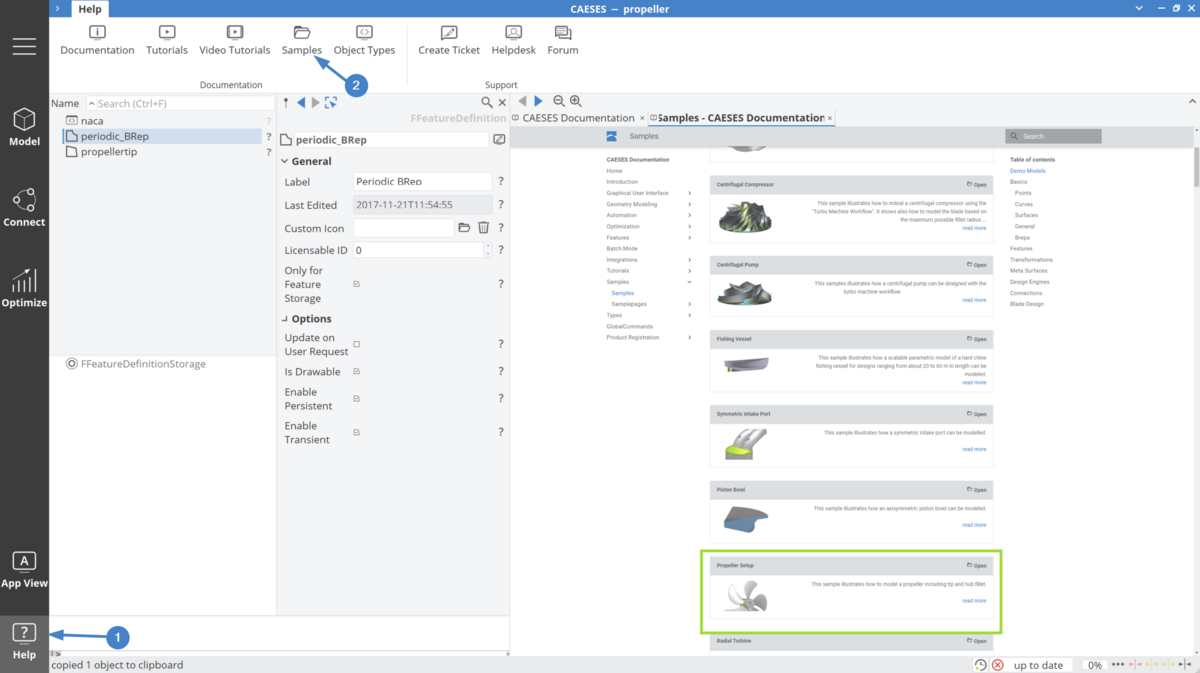
I recommend checking out the propeller tutorial. You can find it by clicking Help in the sidebar (Step 1), then Samples in the upper ribbon (Step 2). Scroll down to find the propeller sample (inside the green rectangle).
More propeller tutorials will be available soon, which might be helpful for your PhD studies.
Best Regards,
Andreas
-
Hi,
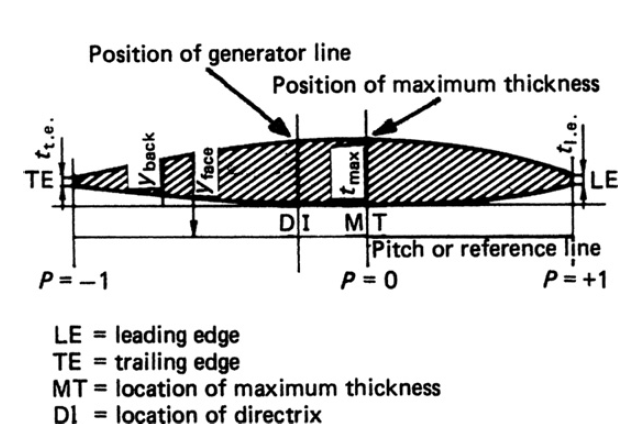
There are no correct values for the extrapolated section thickness at the LE and TE.
Some typical values are the default ones used in the geometry tool for the Wageningen B-series.
Best Regards,
Andreas
-
Hi again,
I have completed the update on the revised file for the tip geometry, which now encompasses the entire propeller. Additionally, I've incorporated parameters such as propeller diameter and the number of blades to ensure its proper functionality.
Please find attached the aforementioned file for your review.
Best Regards,
Andreas

-
Hi,
Attached is a revised version of your project with the correct tip geometry. The changes I made involve setting the camber close to the tip region to zero. This adjustment addresses inconsistencies in tip geometry and does not significantly impact performance, as is common practice in propeller design.
I also included the trailing edge (TE) surface, as required by the NACA geometry used for the curve engine. Given that the engine has an open TE, the blade surface needs to be closed with a TE surface for proper alignment.
In summary, I followed the propeller sample workflow to ensure accuracy and adherence to design standards.
Best Regards,
Andreas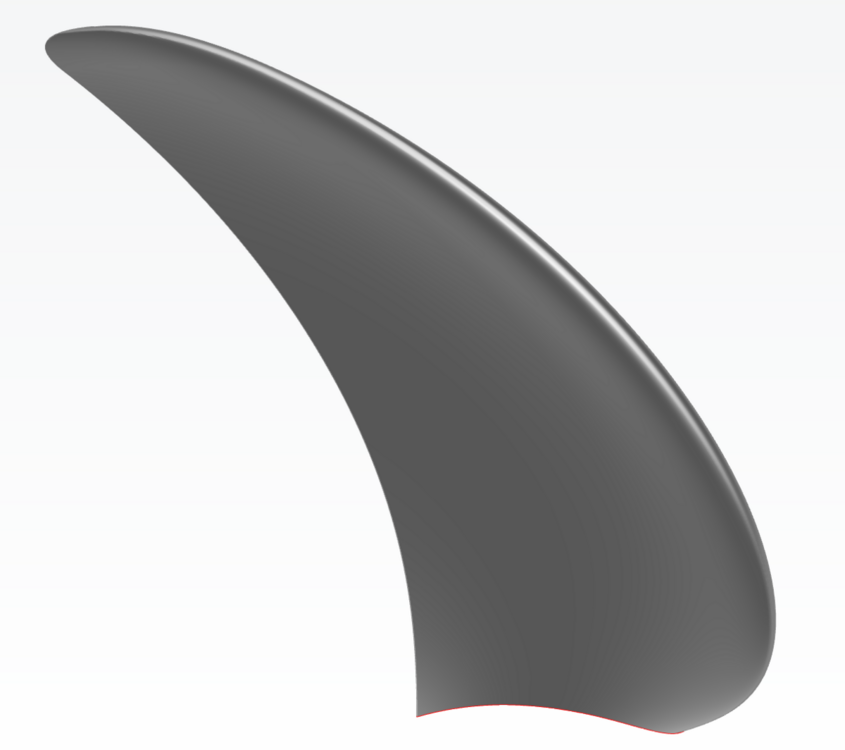
-
Hi,
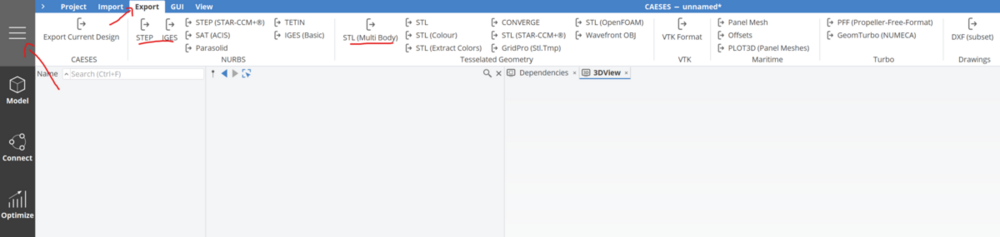
Once you've finalized a design in Caeses, you can export the corresponding geometry by following these steps:
- Click on the three horizontal lines located in the sidebar.
- Next, navigate to the Export option within the Menu workspace.
- You'll then encounter various export options for your geometry, including .stl, .step, or .iges file formats.
- To specify which geometry you want to export, simply select the desired object in the Object Tree. If no specific object is chosen, the export will default to the visible object in the Object Tree.
Please refer to the attached figure for clarification on the export process as well.
Best Regards,
Andreas
-
Hi,
If you explore the Optimization section of the CAESES documentation, you'll find the answer to your question.
Below is the content copied from the documentation:Colors
Colors are of interest to check the (linear) correlations. For instance:- Blue colors indicate a trend such that if the design variable (abscissa) gets increased, the objective increases as well. The regression curve would go up.
- Red colors indicate a negative correlation, i.e., if the design variable gets increased, the objective function decreases.
With this information, you can e.g. check which design variables have no substantial effect on your objective function. These variables could be deactivated in the next optimization stage.
One additional note: Green colors indicate that the regression curve remains steady.
So it's a color map that transitions from blue to red, with green as the intermediate color.
Best Regards,
Andreas -
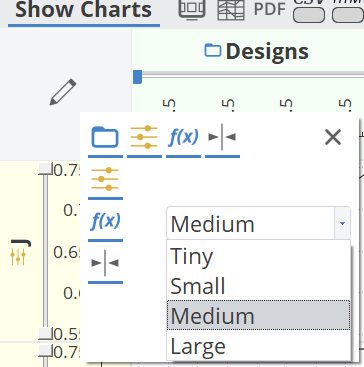
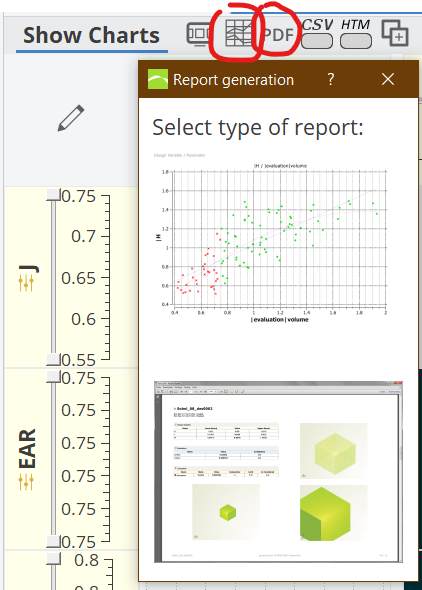
Hi Max,
You can enhance your analysis by capturing screenshots of these diagrams and adjusting the size of the graphs as needed.Alternatively, you can generate images in .PNG format using the "Generate interactive diagram" feature or by creating a PDF report.
Best Regards,
Andreas
-
Hi,
Typically, a B-spline curve of a 3rd degree provides sufficient smoothness for engineering applications, with the number of control points being independent of the curve's degree. This configuration allows for localized control over the curve by adjusting individual control point positions.
In contrast, the number of control points in a Bezier curve is directly tied to the curve's degree. This affords global control over the curve, meaning altering a control point's position affects the curve's shape across its entirety, which may not always be desirable.
In conclusion, increasing the degree of a curve beyond 9 introduces computational complexity that is unnecessary for practical engineering purposes.
Best Regards,
Andreas
-
Hi,
Within CAESES, the input and/or output geometry can be automatically exported to the corresponding folder in an optimization setup.
You can find a demonstration of the integration of STarccm+ with CAESES in our software by accessing the Help workspace and searching for "star-ccm".Best Regards,
Andreas

-
Hi yuvraj,
I have reviewed the CAESES project and observed that in the "Connection" workspace, the OpenFOAM files are not properly oriented within the directory system, 0, and constant.
Please refer to the attached photo to understand how a proper integration OpenFOAM with CAESES should be established with the appropriate folder structure.
Furthermore, you may find a helpful demonstration in an older video from us that illustrates the setup of such an integration: https://www.youtube.com/watch?v=dB9sQxZxqTY
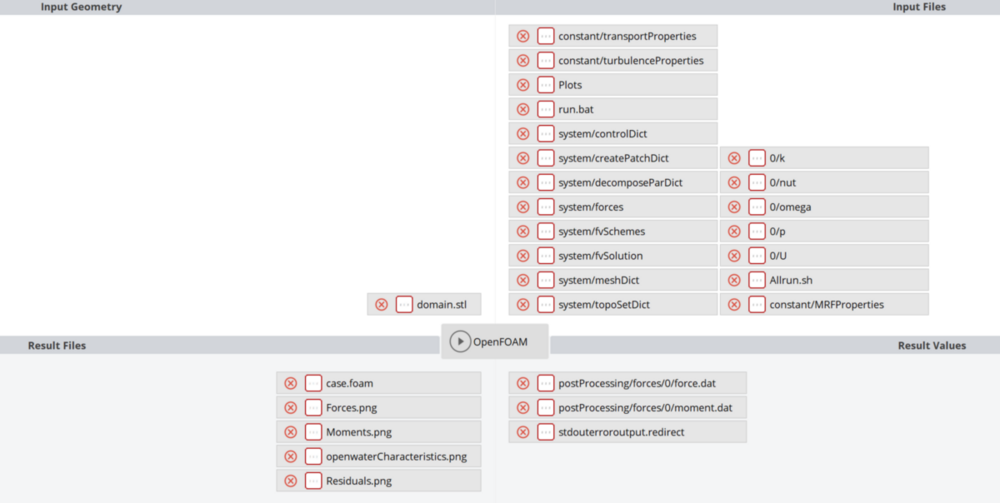
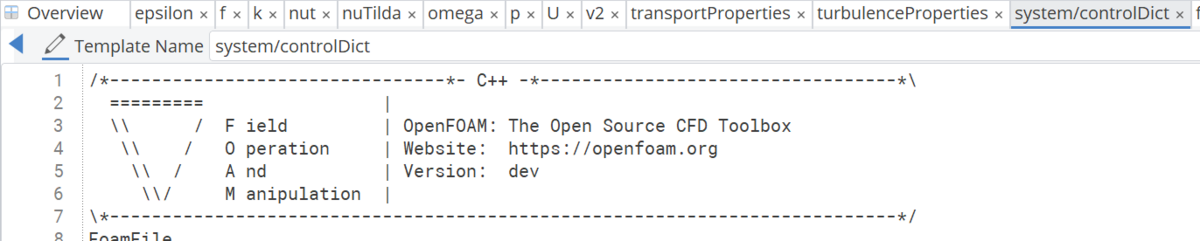
To correct this, you can open the file in CAESES and specify the correct Template Name as seen in the picture below.
Ensure that these changes are applied consistently across all relevant files.

Additionally, it's essential to understand the significance of the system, 0, and constant directories in OpenFOAM.
You can explore the following link for a detailed explanation: https://maplekeylabs.com/understanding-the-openfoam-case-structure/Please let me know if implementing these adjustments resolves the issue you were experiencing.
Best Regards,
Andreas -
Dear 司思Si Si,
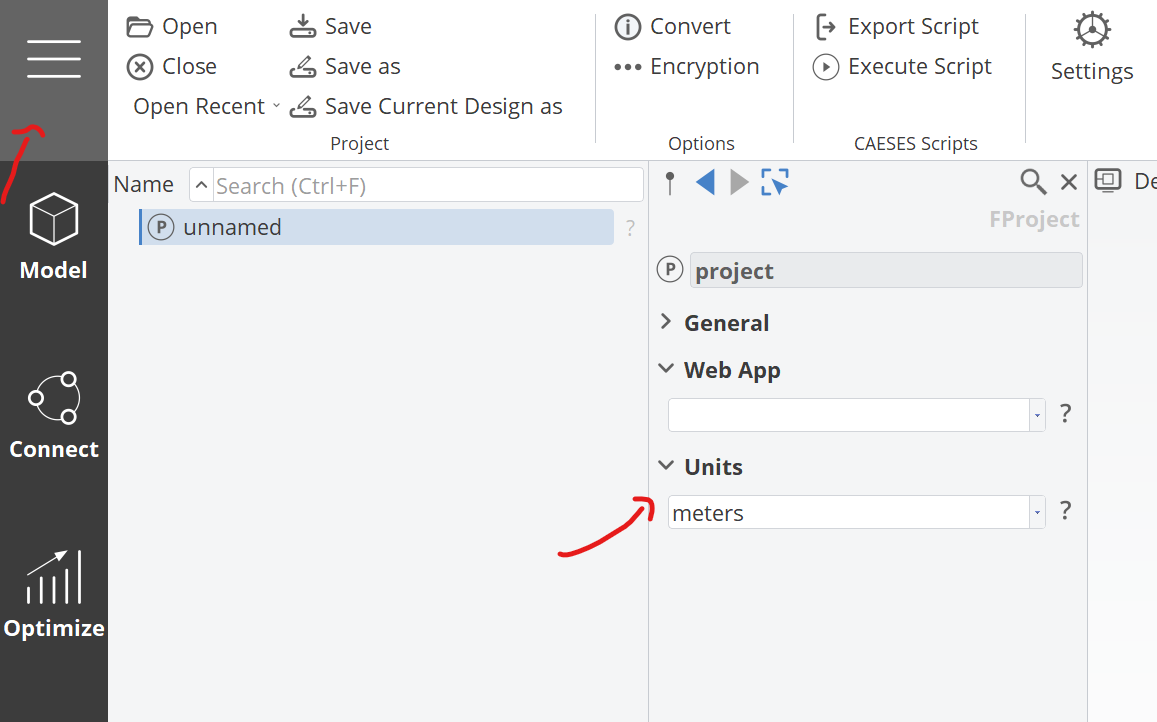
Please verify in Caeses that the units are correctly set to the appropriate ones.
For instance, you might have specified units in millimeters, but if the project is set in meters, overlooking this could potentially explain why the model appears to be consistently magnified by a factor of 1,000.
Best Regards,
Andreas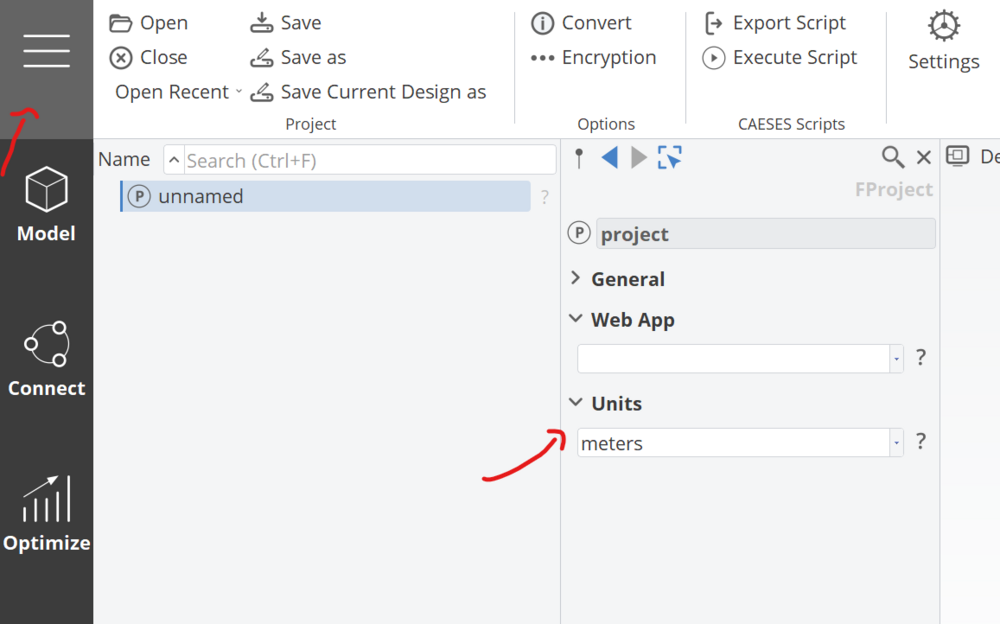
-
Hi again,
Hi Sisi,
I recommend starting by examining the sample propeller provided in CAESES, as it offers a comprehensive representation of geometric modeling for a propeller, encompassing both the hub and tip.
Best Regards,
Andreas
-
Hi again,
I recommend starting by examining the sample propeller provided in CAESES, as it offers a comprehensive representation of geometric modeling for a propeller, encompassing both the hub and tip.
Best Regards,
Andreas
-
Hi Sisi,
The B-series propeller is currently not available as a sample in CAESES.For a design of such a propeller, you can visit our web application at: https://www.wageningen-b-series-propeller.com/
Additional information about these tools can be found in this post: https://www.caeses.com/news/2018/wageningen-b-series-online-propeller-tool-released/Given that the B-series is widely recognized as one of the most comprehensive and commonly used propeller series in marine propulsion, you can also access extensive information in various academic papers.
Alternatively, you can explore a conventional propeller sample that is not based on the B-series. This allows you to independently examine a typical propeller workflow within CAESES.
Best Regards,
Andreas -
Hi Yukai,
Unfortunately, it seems there's an issue with a Linux library.
To address this, could you please try removing the files named libssl.* and libcrypto.* from the lib directory within the CAESES installation?
Best Regards,
Andreas -
Hi Yukai,
In general, it is always recommended to use the latest version, but I don't believe this is causing any issues. Please carefully compare the input files and geometries in both scenarios.
Additionally, examine the OpenFOAM log file to identify any differences between the two scenarios. It's possible that while the input geometry remains the same, a distinct mesh is being generated for some reason and this mesh is serving as the input in OpenFOAM.
Inspect the mesh generator's properties to ensure there are no hidden factors contributing to instability.
As far as the CAESES setup is concerned, there shouldn't be any significant differences compared to the manual process. The only distinction lies in executing the "Allrun.sh" command from the CAESES GUI rather than directly from the console.
Best Regards,
Andreas -
Hi Yukai,
Please reevaluate to ensure consistency between the input files and input geometries in both scenarios.
Additionally, examine the CAESES stdouterroroutput.output file, serving as a log file, to review the solver output and understand the current processes.
Best Regards,
Andreas -
Hi Yukai,
Feel free to post your questions on the forum or submit a ticket within CAESES.
Myself or any other member of the Support team will be available to assist you.
Best Regards,
Andreas -
Hi Yukai,
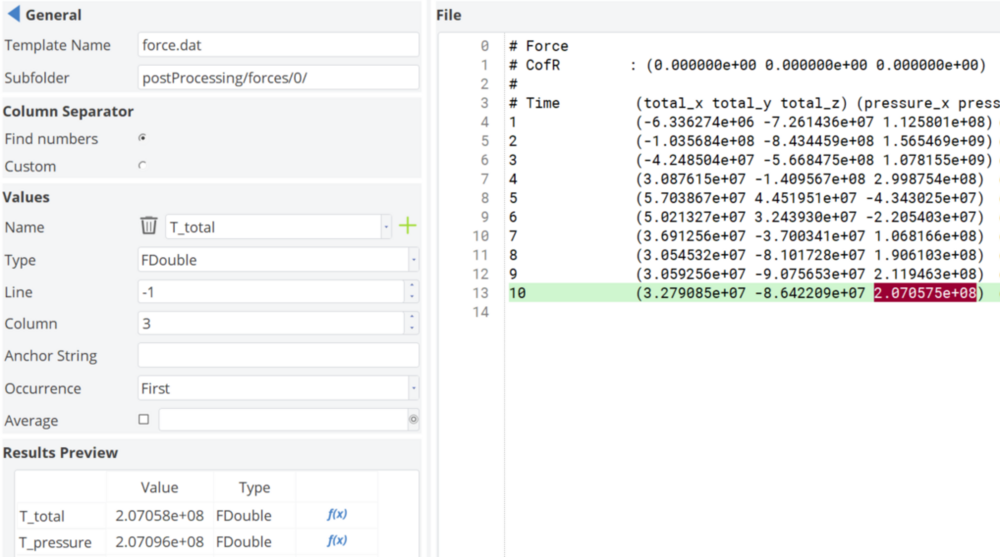
The force in the last line is the converged value from the solver.
I would suggest to use a python code only for post-processing.
For example, if you want to plot the convergence history of the forces over OpenFOAM iterations.
By parsing various values, such as force in x-axis to parameters and establishing a robust integration CAESES with OpenFOAM, then you can continue with a Design of Experiments and/ or with a Optimization process.
Best Regards,
Andreas
-
 1
1
-
-
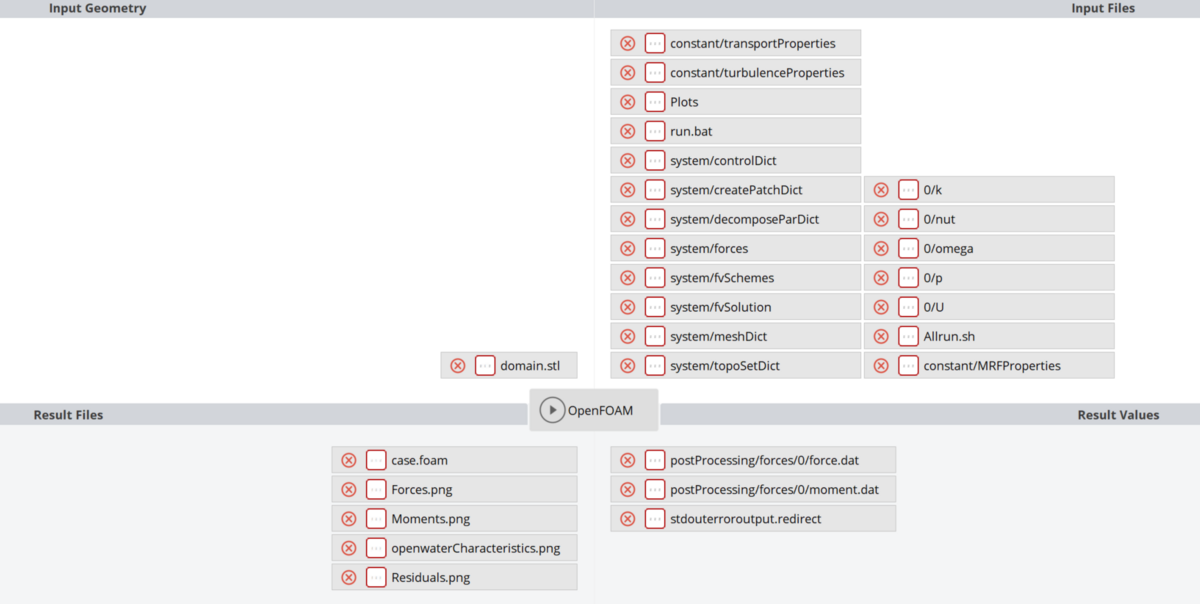
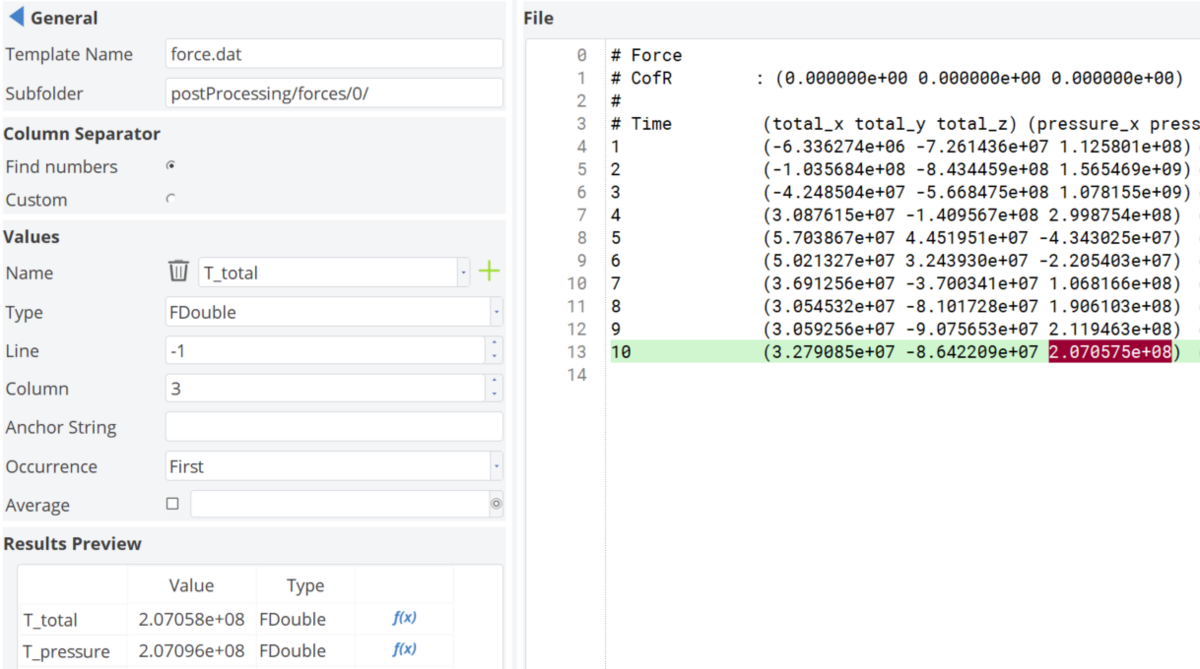
Hi Yukai,
OpenFOAM is notably complex when it comes to managing numerous processed files. To address this complexity, I've included a screenshot featuring a standard connection input file, geometries, output files, and corresponding values. It's advisable to consistently employ relative paths by utilizing the subfolder option, as illustrated in the second screenshot.To extract parameters from the force.dat file, you can directly navigate to the last line, which typically represents the converged value from OpenFOAM. This can be achieved using the -1 option in the command line.
Moreover, consider incorporating a Python file for post-processing and integrating it into your connection. This can be facilitated by incorporating the Python script as a command line within the Allrun.sh executable file.
Best Regards,
Andreas
-
1
-


Error message: failed to extend given source curve
in General Modeling
Posted · Report reply
Hey Luca,
Sorry for the late response.
Please find attached the CAESES project, which includes the proper import of the E817 profile as a text file, along with its parametrization.
The project also contains some parametric distributions for the blade geometry, which you are free to modify based on your preferences.
There is currently a minor issue with importing profiles in CAESES, which we are working on.
For now, the profile dat file needs to be formatted in the specific way shown in the attached file to be read correctly.
Please let me know if this works for you.
Best Regards,
Andreas
E817 blade.cdbc output-onlinetools.txt