


MIHCool
-
Content Count
4 -
Joined
-
Last visited
Posts posted by MIHCool
-
-
Hi again,
thank you for your reply.
I am using 5.0.11 now. it provides more options which is nice.
then it seems I have a surrogate model then and I can see blue dots which are Pareto fronts.
Would you please tell me how can I plot 3D surface response?
Also I did not connect my simulation tool to the CAESES. I have input and simulated outputs. I can use these data (56 rows) in CAESES (without connecting it to the external simulation tool) to find the reasonable Pareto fronts, right?
Regards
-
Dear Mr. Heinrich von Zadow,
Hello and thank you for your reply.
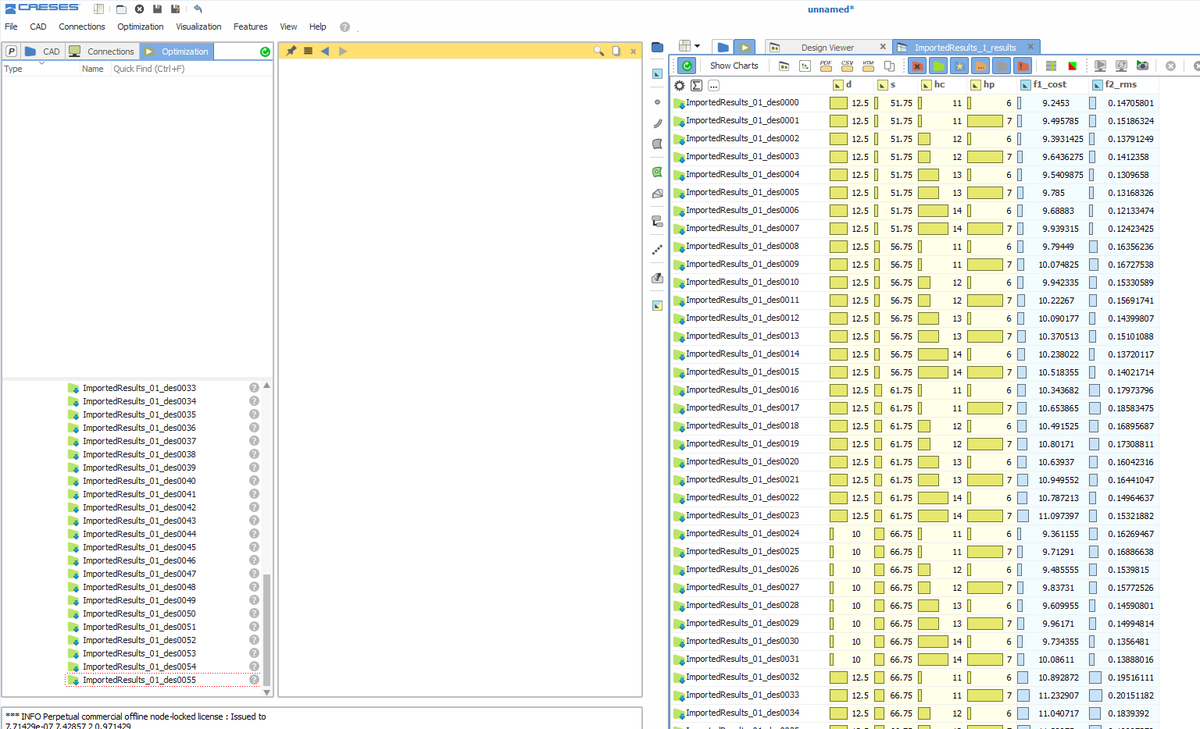
I am using CAESES version 4.4. I have imported the variables using "import results pool" and allocated the variables and outputs to the columns and after that the software automatically ran the analysis. see 002.png
Do I need now to select the Dakota and run the simulation again. I need to generate a surrogate model and use it for my optimization.
Best Regards

-
Dear All,
Hello
I would like to ask some questions regarding my optimization project and would appreciate it if you could answer them.
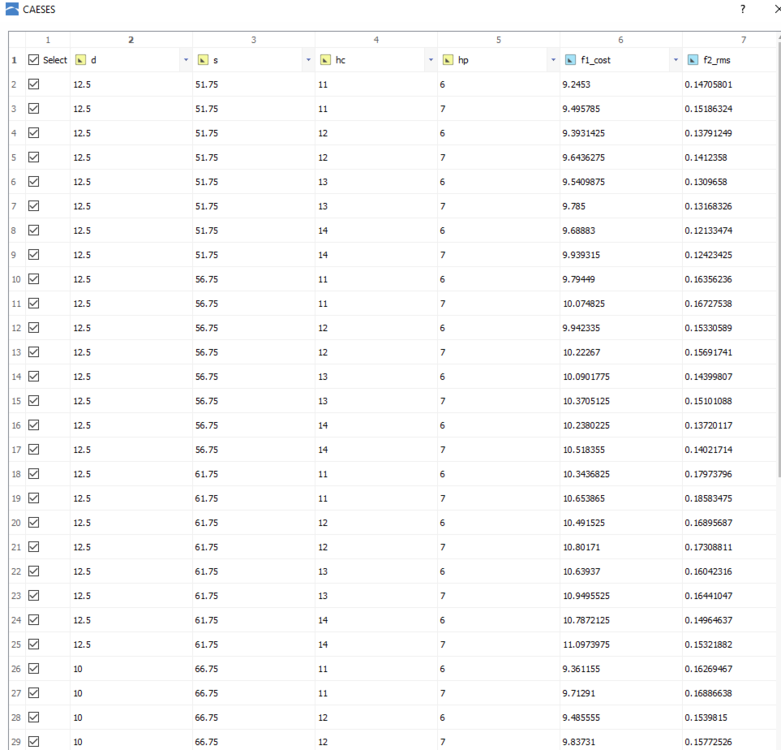
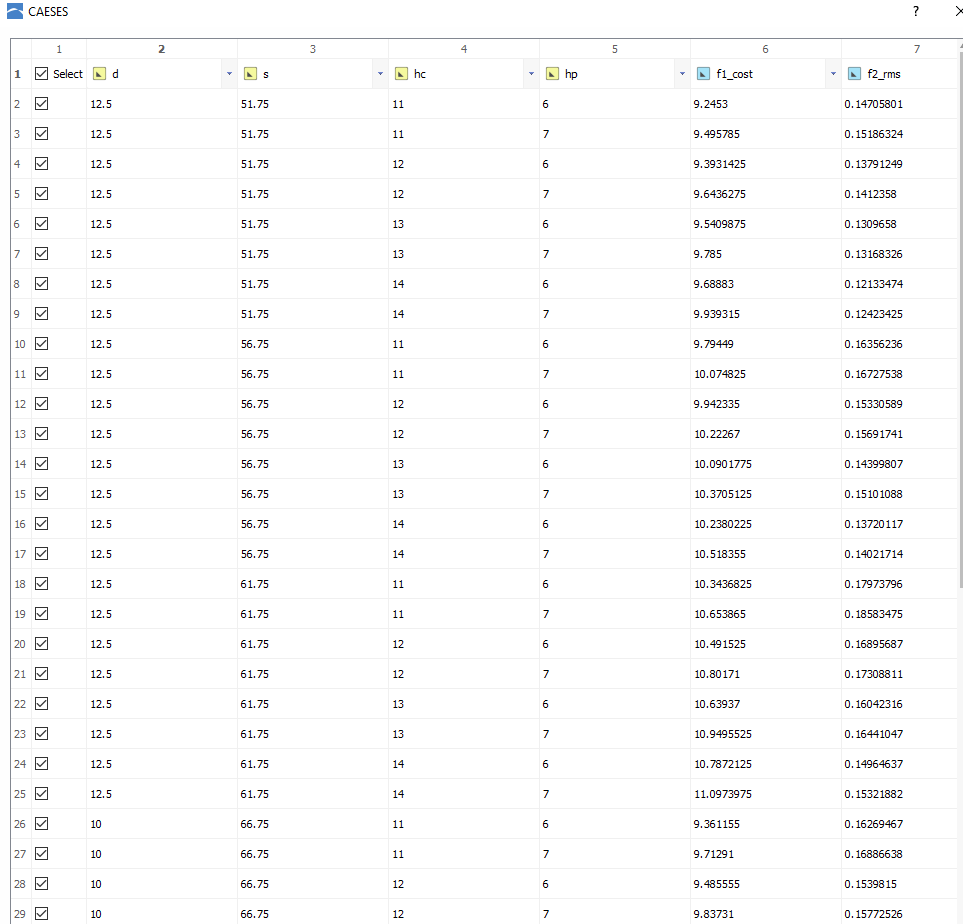
I am working on the optimi9zation of the floating vessel's hull. I have done the simulations for 56 geometries and got the results (y1 and y2 in the attached file).
As you can see in the attached file, there are 4 design variables (x1, x2, x3 and x4) which each of them corresponds to specific y1 and y2.
1. now the question is how can I define these data in the CAESES, "CAD" section. Is there a way to tell the software that for specific (x1, x2, x3 and x4) there are specific (y1 and y2) ?
2. I have run the CAESES with some values just for testing, and I was wondering how can I plot 3D response surface using the results from Dakota?
Best Regards
Thank you in advance
Milad
CAESES input and response surface visualization
in Variation & Optimization
Posted · Report reply
Dear Mr. Heinrich von Zadow,
Hello again and thank you for your reply
I could get the suitable results for my work.
Now I want to plot the Pareto fronts and other graphs in python and excel. Is there any way to export the results from CAESES to Excel?
Regards