


Mr. Victor Bolbot
-
Content Count
14 -
Joined
-
Last visited
Posts posted by Mr. Victor Bolbot
-
-
Hi,
It would great, if it was possible to draw lines, arrow, text in diagram viewer.
Regards,
Victor Bolbot
-
Hi,
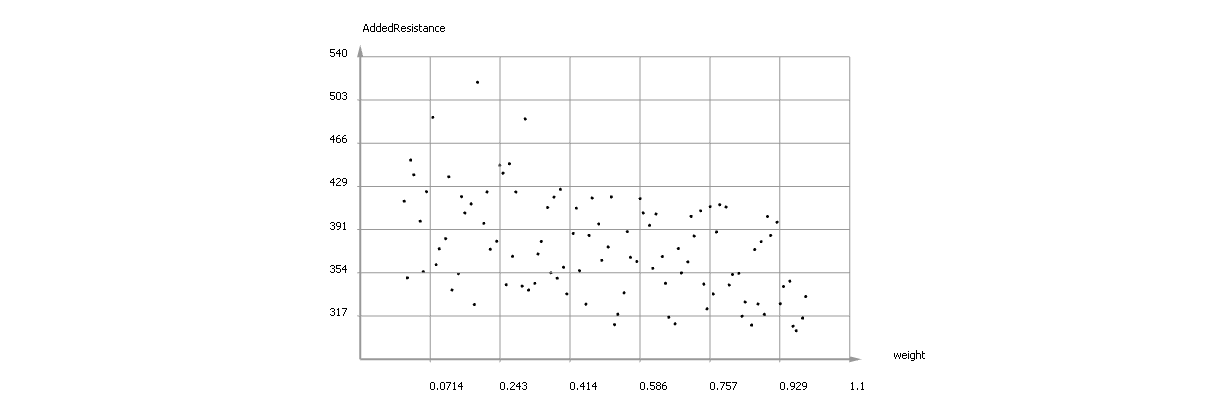
When I wanted to present results of an optimization process, it was necessary to adjust axis discretization. For instance, the discretization in x-axis was 0.0714, 0.243, while I wanted 0.1, 0.2, etc as can be seen in attached picture. The same happened with y-axis. As I understood, that is not possible in CAESES, so I had to use other utility.
This is a change I would really like to see in CAESES.
Regards,
Victor Bolbot
-
Thank you for quick response Karsten.
-
Thank you Karsten.
But I would like also to change the position of grid, not only the upper and lower bounds. I mean in x-axis the grid to be on 0.1, 0.2 ,0.3 0.4, ..1 and on y-axis on 320, 340, 360, ...540.
Cheers,
-
Good morning!
Is it possible to draw a line, arrow, write text in diagram viewer, in CAESES without using other programm?
Regards,
Victor Bolbot.
-
Good morning!
I would to ask to help me to adjust axis subdivision in diagram viewer. It gives me in x-axis values 0.0714, 0.243, etc., but I would to get 0.1, 0.2 etc. The same happens in y-axis.
Any hint?
Regards,
Victor

-
If anybody needs modified bessel functions of first and second kind (first order) here is the best solution that I found. The two formulas seem to work well in range between 0.4 and 40.
Cheers,
Victor
-
Thank you Arne!
Cheers,
Victor.
-
Hi,
I have to use modified Bessel functions of the first and second kind in my calculations. I checked in Caeses, didn't find any relevant, so decided to write a feature. However, these functions to achieve accurate results need too much time. And because it's necessary to use them in iteration process, the problem becomes even worse.
Any hint how to improve the code? I attach the features to the post
Regards,
Victor Bolbot
-
 1
1
-
-
Hi,
I would like to write a feature and for better controling of the process, I would like to use functions that return as result a number. The value of the number is necessary for further calculations.
Regards,
Victor
-
Thank you Jörg!
Your advice was very helpful!
Cheers,
Victor
-
Hello Claus,
Thank you for your responce.
The problem is that this function doesn't appear as a choice. If I simply type the function, it doesn't work too.
Friendly,
Victor
-
Hi,
I would to like to find a z coordinate of centroid of bulb section. I have the curve, can calculate the area of section, but have no information about position of centroid. Any hint?
Regards,
Victor


Problem with exporting .gif
in Post-Processing
Posted · Report reply
Hi
I want to export variations of parametric model as animated GIF. I can see the variations in design view, but when I press "export row as animated.gif" and set the settings, the return message in command window is *** INFO GIF export : No valid images found. What may be wrong?
Regards,
Victor